Research-backed guidance for audience, platform, creative, and campaign planning.
Seven decisions in 2027 before the first creator brief
A useful creator strategy answers seven business questions: who to prioritize, what to offer, where to appear, who should tell the story, what to commission, how people can buy and what would justify another investment.
Three findings that change the planning conversation
- 44.8%report at least one monthly purchase based on creator suggestions
- 37%do not know how many product exposures they need before buying
- 21.6%select immediately or within a day in the purchase-timing question
Statista U.S. Pulse, January 13-20, 2026; all respondents, n = 1,050. Combined shares calculated from counts. Self-reported behavior and estimates.
The seven planning decisions

Step | Decision to make |
|---|---|
1. Objectives and audiences | Business result, audience and hypothesis. |
2. Category opportunity | Product need and proposition to test. |
3. Platforms and placements | Where to appear and each placement's job. |
4. Creators and creative | Partner fit and creative boundaries. |
5. Content and cadence | Deliverable roles and repeated contact. |
6. Purchase experience | Information, offer and purchase destination. |
7. Budget and measurement | Full costs, evidence and decision rules. |
NeoReach planning recommendations; the sequence is not a measured conversion funnel.
Five NeoReach cases illustrate execution. Their results remain separate from the surveys. This evidence supports focused tests, not a universal return forecast.
Define your objectives and priority audiences
Begin with the action the business needs. In the consumer survey, 54.9% selected at least one creator-influenced action. Trying food or a restaurant and purchasing a product were different response options. That distinction matters when you turn a broad influence claim into a campaign objective.
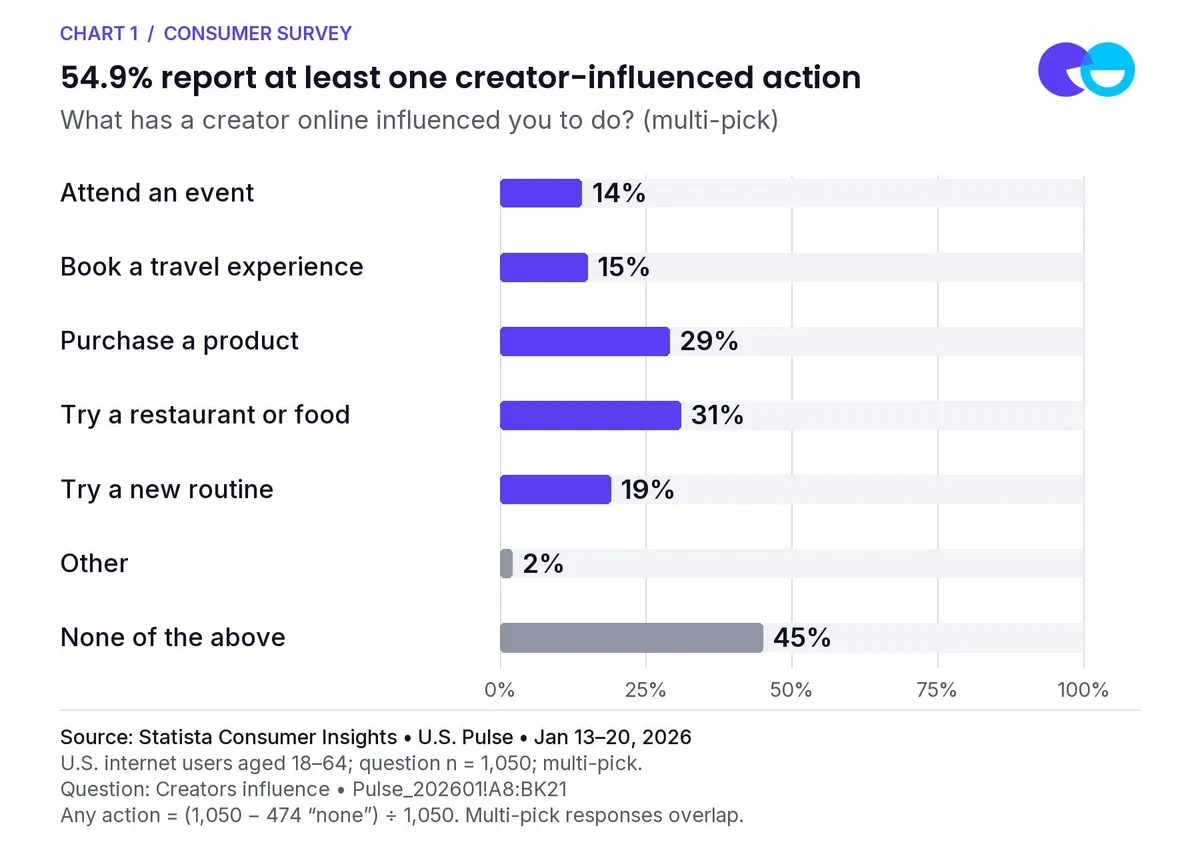
Chart 1: 54.9% report at least one creator-influenced action. What has a creator online influenced you to do? (multi-pick). Source: Statista Consumer Insights • U.S. Pulse • Jan 13–20, 2026. U.S. internet users aged 18–64; question n = 1,050; multi-pick. Any action = (1,050 – 474 "none") ÷ 1,050. Multi-pick responses overlap.
PUT IT IN THE BRIEF: Name one primary business objective, one intended audience action and the evidence needed to judge it. Product discovery, a qualified visit, a retail redemption and a completed order require different content and measurement.
Agree the objective across brand, ecommerce and measurement before selecting creators. Report secondary signals without letting them replace the approved commercial result.
Monthly purchasing varies sharply by generation
44.8% reported at least one monthly creator-recommended purchase. The share ranged from 68.3% for Gen Z to 11.4% for the Baby Boomer group. Use these differences to prioritize audience hypotheses alongside customer value, product relevance and growth potential.
- 68.3%Gen Z reporting at least one monthly creator-recommended purchase
- 11.4%Baby Boomer group reporting at least one monthly creator-recommended purchase
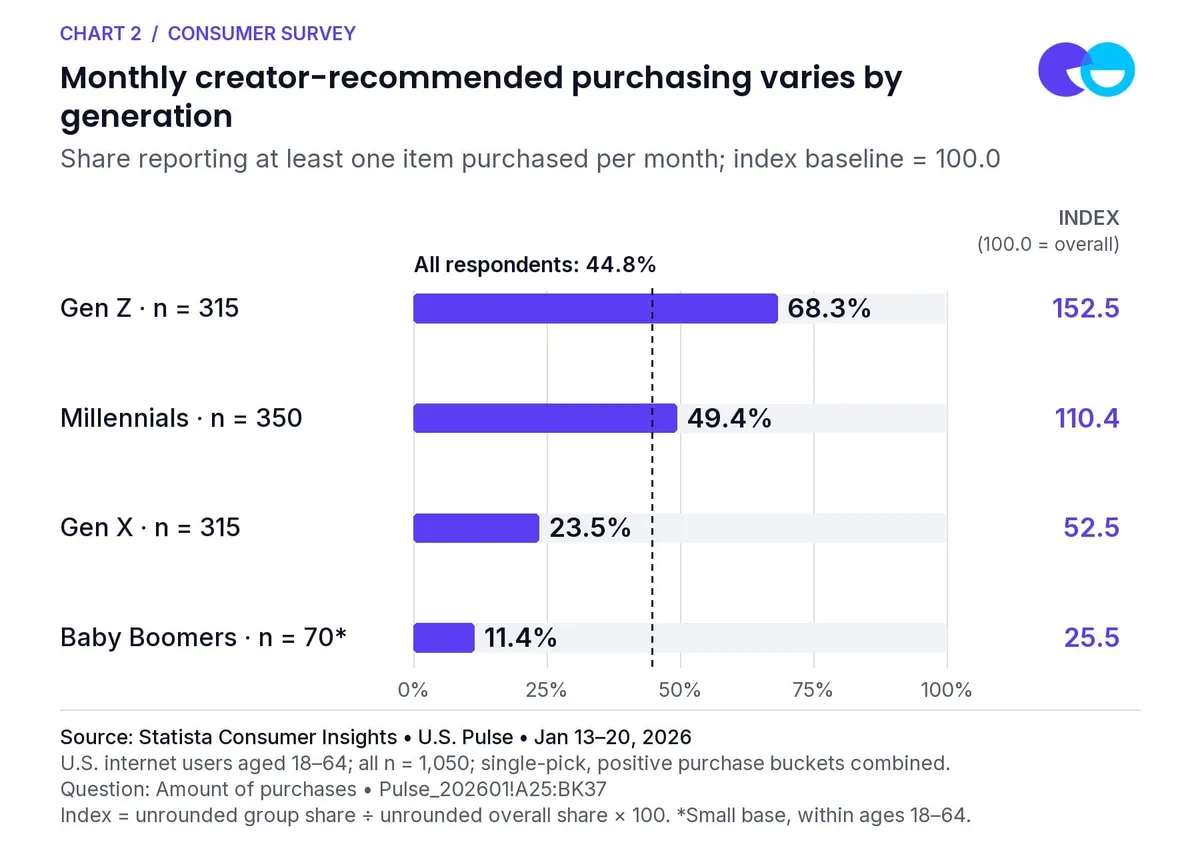
Chart 2: Monthly creator-recommended purchasing varies by generation. Share reporting at least one item purchased per month; index baseline = 100.0. Source: Statista Consumer Insights • U.S. Pulse • Jan 13–20, 2026. All n = 1,050; single-pick, positive purchase buckets combined. Index = unrounded group share ÷ unrounded overall share × 100. *Small base, within ages 18–64.
An index of 152.5 for Gen Z means its reported monthly-purchasing share is 1.525 times the full sample share. It says nothing about average order value, profit or the return a new campaign will deliver. The comparison describes these respondents; it is not a budget allocation rule.
KEEP THE AUDIENCE DEFINITION ATTACHED: The consumer study covers U.S. internet users aged 18-64. Its Baby Boomer group has only 70 respondents and represents the portion of that generation within the survey age range. Do not generalize that small group to all older consumers.
NVIDIA made the student use case the starting point
For its 2022 back-to-school campaign, NVIDIA wanted to show how GeForce RTX 30 laptops could support both schoolwork and gaming, while encouraging visits to its website. The brief focused on U.S. students in technology, STEM, engineering and data science. That gave creator selection a concrete purpose.
CAMPAIGN IN PRACTICE
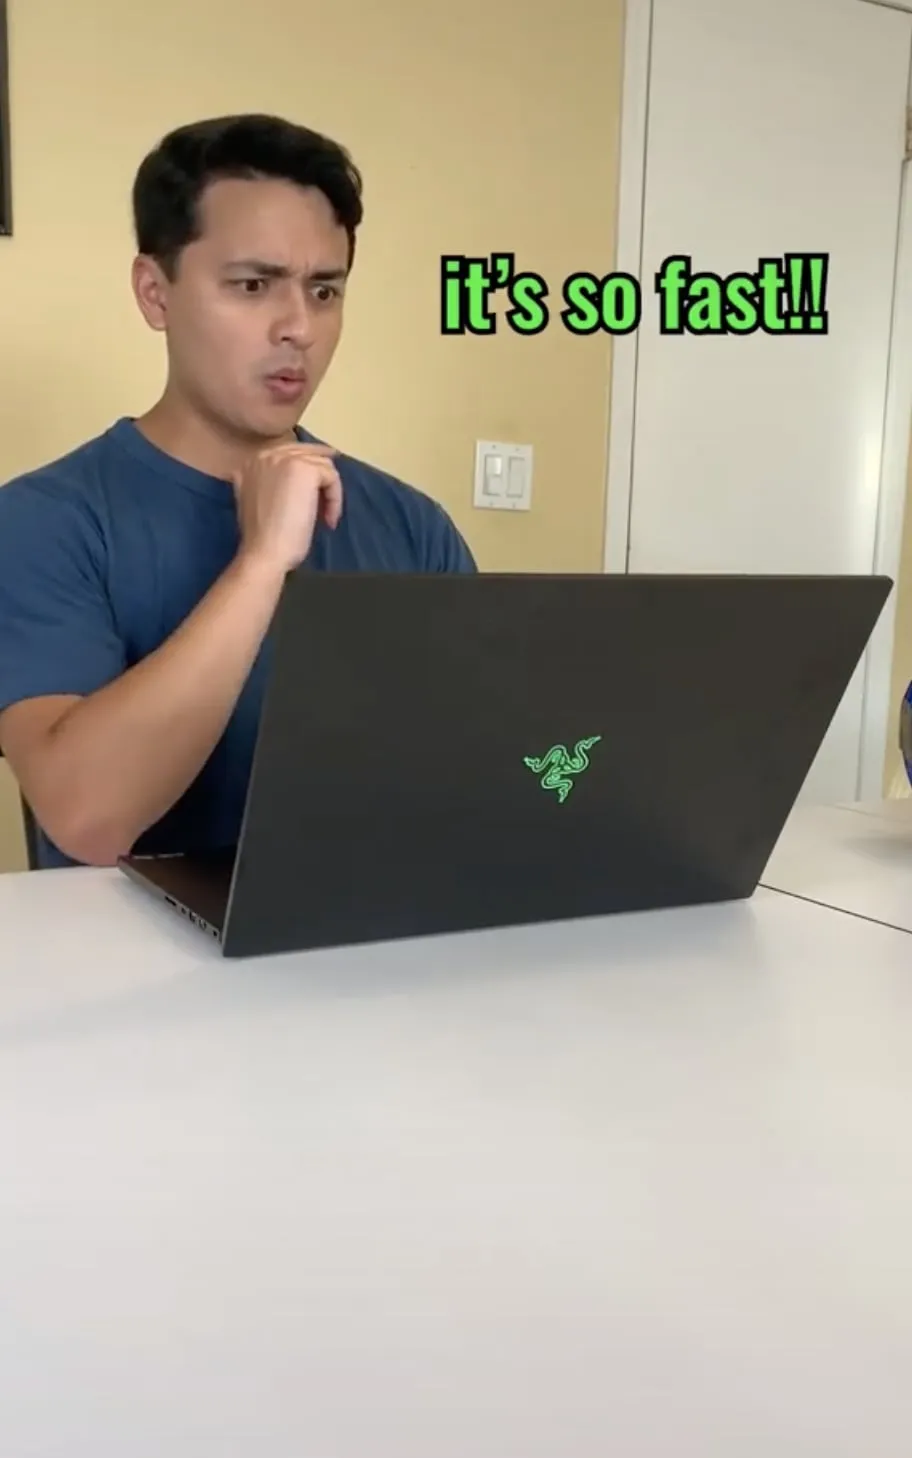
Four creators translated the proposition into projects, laptop benefits and gaming scenarios. "Build Something Awesome" and "Benefits of the Laptop" were useful creative prompts because they connected a product capability to a recognizable student task. The campaign delivered three TikTok posts and one dedicated YouTube video, with paid TikTok support.
APPLY THE PRINCIPLE: Start with the audience's task, then select creators who can make the product's role visible. An enterprise brief should state the customer context, the benefit to demonstrate and the intended next action. The generation chart can inform prioritization; it cannot write that use case for you.
Sources: NVIDIA campaign recap, September 27, 2022, slides 2-5 and 10. Explore the NVIDIA case study. Campaign delivery results appear in Step 3. The still shown is from TikTok.
Identify your category's opportunity
Food and beverage led the stated purchase preferences at 35%, followed by clothing and accessories at 26% and beauty and skincare at 24%. These answers show where respondents say a creator recommendation could matter. They do not describe category market share or observed campaign conversion.
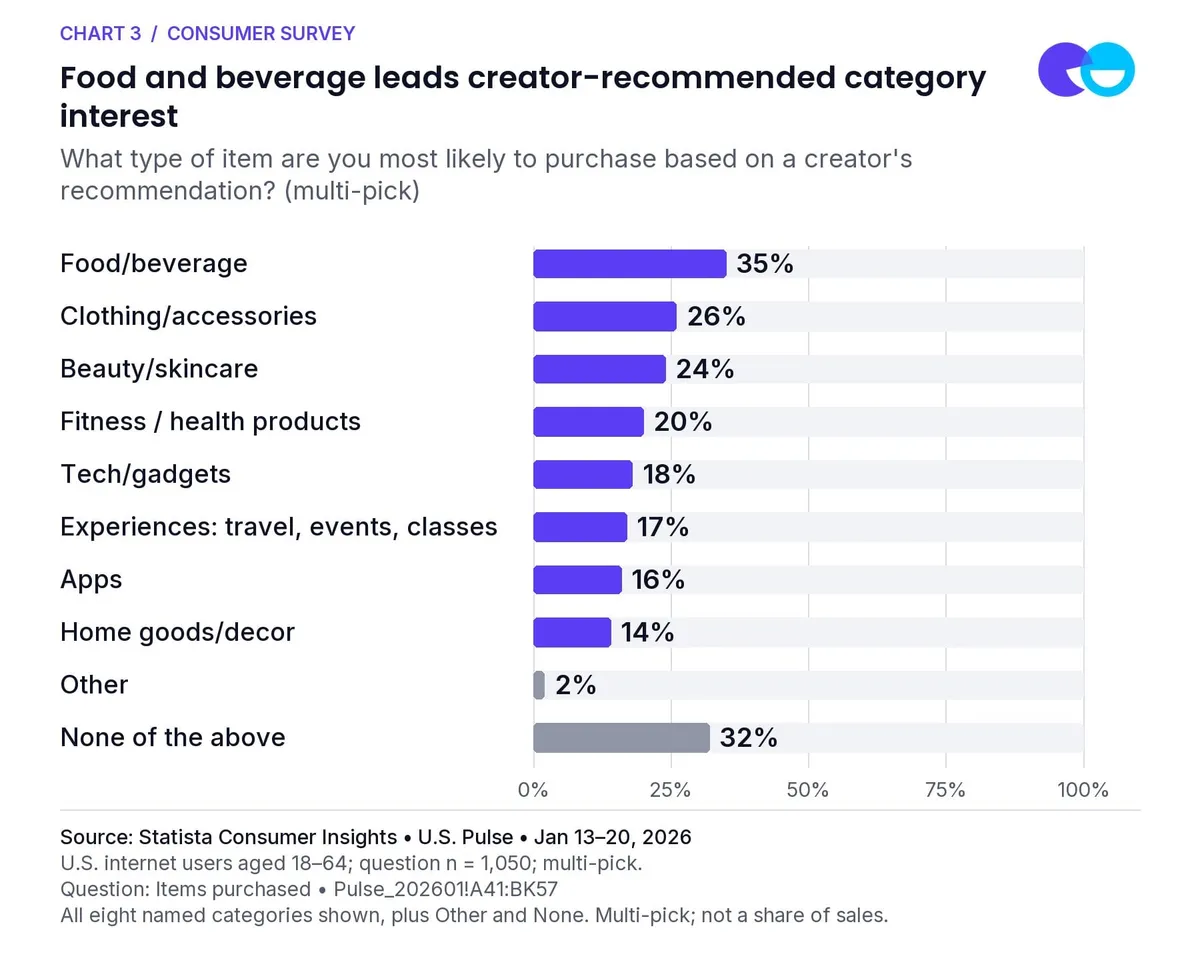
Chart 3: Food and beverage leads creator-recommended category interest. What type of item are you most likely to purchase based on a creator's recommendation? (multi-pick). Source: Statista Consumer Insights • U.S. Pulse • Jan 13–20, 2026. U.S. internet users aged 18–64; question n = 1,050; multi-pick; not a share of sales.
MAKE A PORTFOLIO CHOICE: For each candidate product, write the customer need, the creator's useful role and the purchase barrier the content could address. Prioritize a proposition that combines audience interest with distribution readiness and viable unit economics.
Selections can overlap; 32% chose none. The ranking does not guarantee a winner. Your product needs its own reason to be considered.
Use demographic differences to sharpen the proposition
Beauty and skincare was selected by 32% of women and 15% of men. For technology and gadgets, 24% of men and 12% of women selected the category. These comparisons can help an insights team frame a test; they cannot replace research into the actual use case.
Show data
Women | Men | |
|---|---|---|
Beauty/skincare | 32 | 15 |
Tech/gadgets | 12 | 24 |
Within an enterprise portfolio, the practical question is which product story deserves attention from which audience. A beauty proposition might focus on application, finish or a specific product attribute. A technology proposition might focus on a task, setup or use environment. Match the audience hypothesis to the product question before selecting creators.
AVOID A SHORTCUT THROUGH THE CROSS-TABS: Gender and generation are separate breakdowns here. The workbook does not establish the preferences of combined groups such as Gen Z women. Build any intersectional audience hypothesis from additional research or your own test, and assess creators beyond demographic labels.
Buffalo Wild Wings after dark
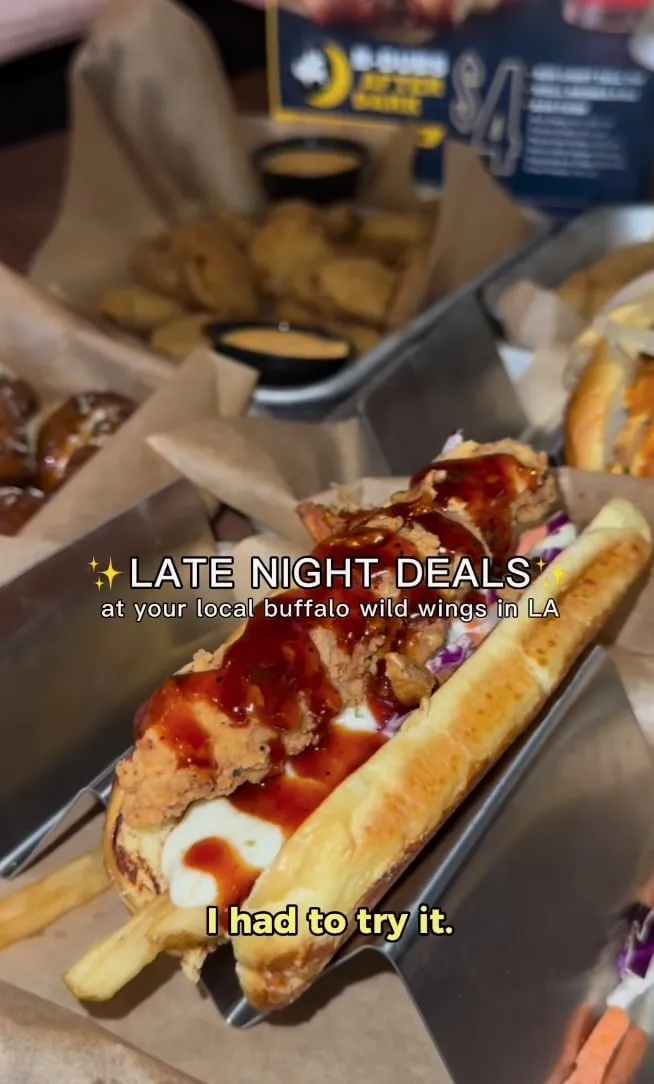
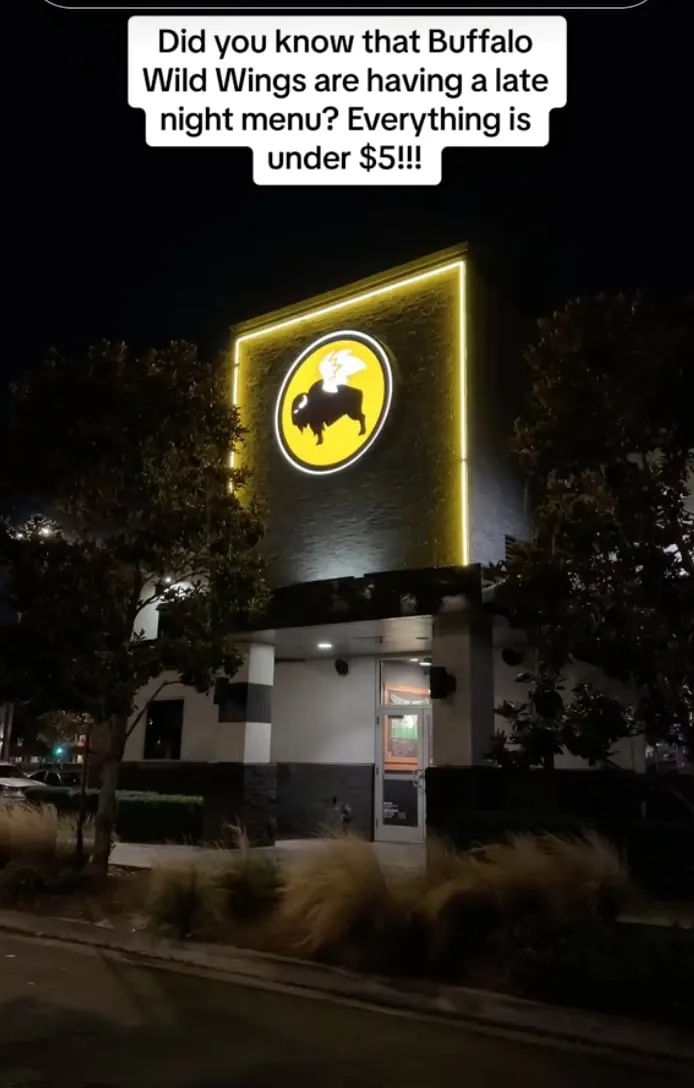
Buffalo Wild Wings used seven creators on TikTok and Instagram to promote late-night deals in 2023. At Los Angeles-area restaurants, creators put mozzarella sticks, pretzel knots, fried pickles and Bird Dawgs into a social occasion, with links to the location finder.
THE OFFER AND THE DESTINATION
Reported campaign delivery
- 3,762,159impressions
- 396,176engagements
July/August 2023 recap; live-post log August 15-29. The recap does not separate paid and organic impressions or report store visits or sales.
APPLY THE PRINCIPLE: Make the category opportunity specific: a late-night gathering, a relevant menu and a way to find the restaurant. Define the occasion and destination before choosing creators. This case illustrates a proposition; it does not validate the survey.
Source: Buffalo Wild Wings campaign recap, July/August 2023, slides 1-7. The audience was the selected creators' followers; the recap does not quantify audience demographics. Results are source-reported, not a test of the survey finding.
Choose your platforms and placements
Ask where people discover creator-recommended products, not only which apps they use. Overall, 31% selected YouTube video descriptions, 28% TikTok videos and 25% Instagram Stories. Among Gen Z, those figures were 37%, 47% and 42%, respectively.
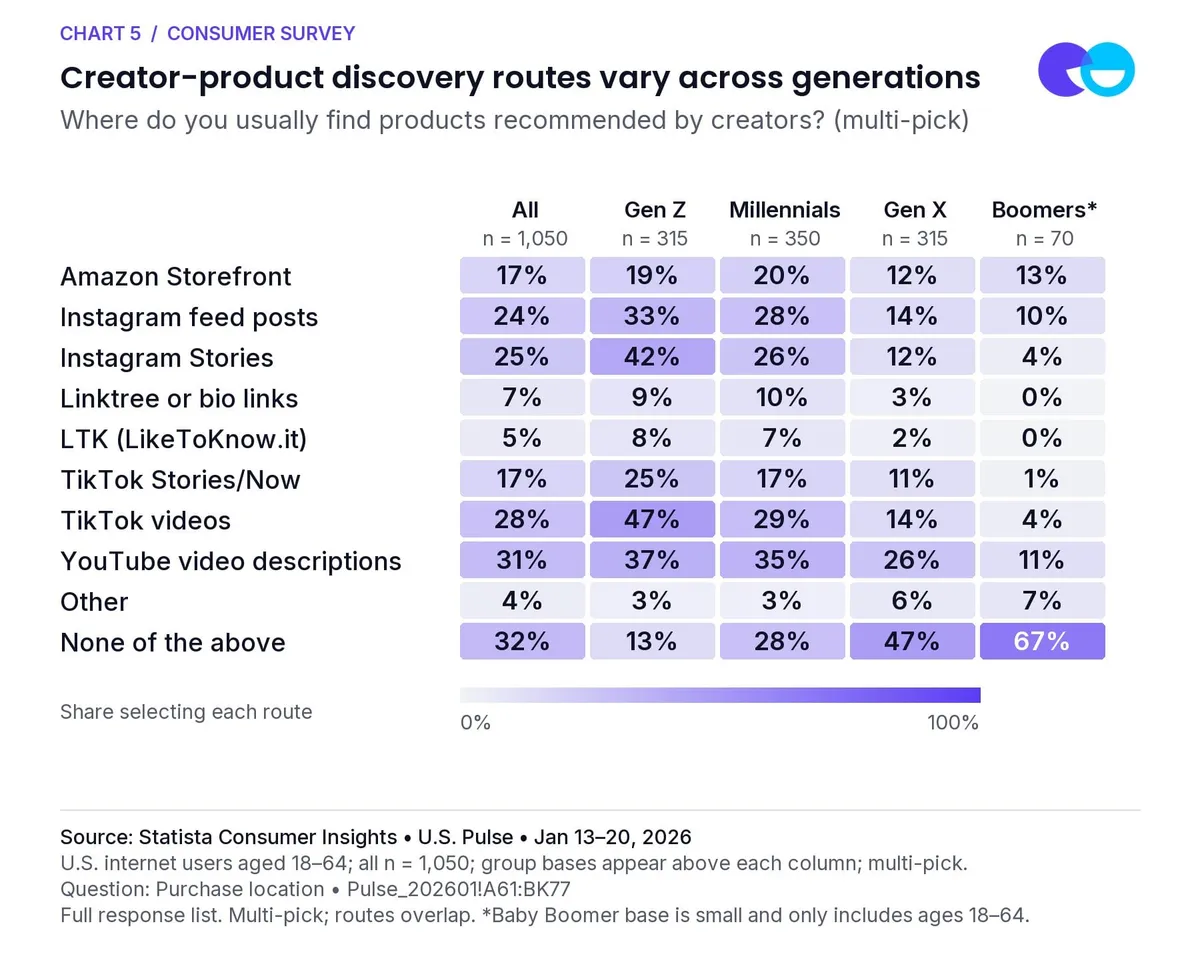
Chart 5: Creator-product discovery routes vary across generations. Where do you usually find products recommended by creators? (multi-pick). Source: Statista Consumer Insights • U.S. Pulse • Jan 13–20, 2026. Multi-pick; routes overlap. *Baby Boomer base is small and only includes ages 18–64.
TURN A PLACEMENT INTO A DELIVERABLE: Specify the content format, product explanation, link location and destination. A video, a Story and a description link are different parts of the experience. The survey options are not an exhaustive platform inventory, and discovery shares are not recommended budget weights.
Keep platform usage separate from product discovery
The broader 2025 survey provides context: 70% reported regular Facebook use, 62% YouTube, 53% Instagram and 45% TikTok. This is a different question, study period and respondent base from the creator-discovery research.
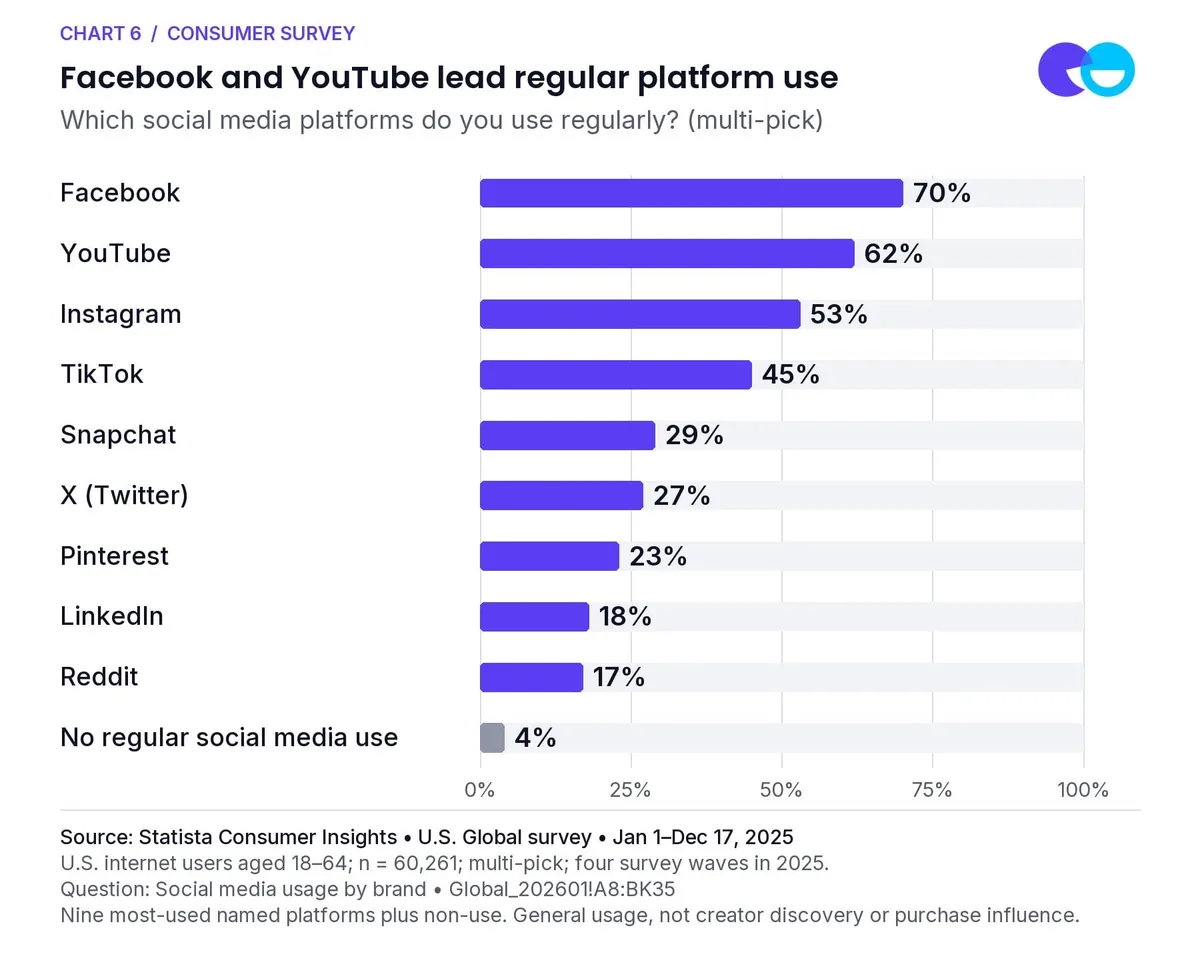
Chart 6: Facebook and YouTube lead regular platform use. Which social media platforms do you use regularly? (multi-pick). Source: Statista Consumer Insights • U.S. Global survey • Jan 1–Dec 17, 2025. U.S. internet users aged 18–64; n = 60,261; multi-pick; four survey waves in 2025. General usage, not creator discovery or purchase influence.
Facebook was not a named option in the separate creator-discovery question. Its absence cannot establish that Facebook creators have no influence.
AGREE THE PLACEMENT TEST WITH MEDIA AND ECOMMERCE: Choose placements for audience fit and a defined job. Check creator capability, paid usage rights, production needs and the destination. Set the test budget independently of survey percentages.
One story across two platforms
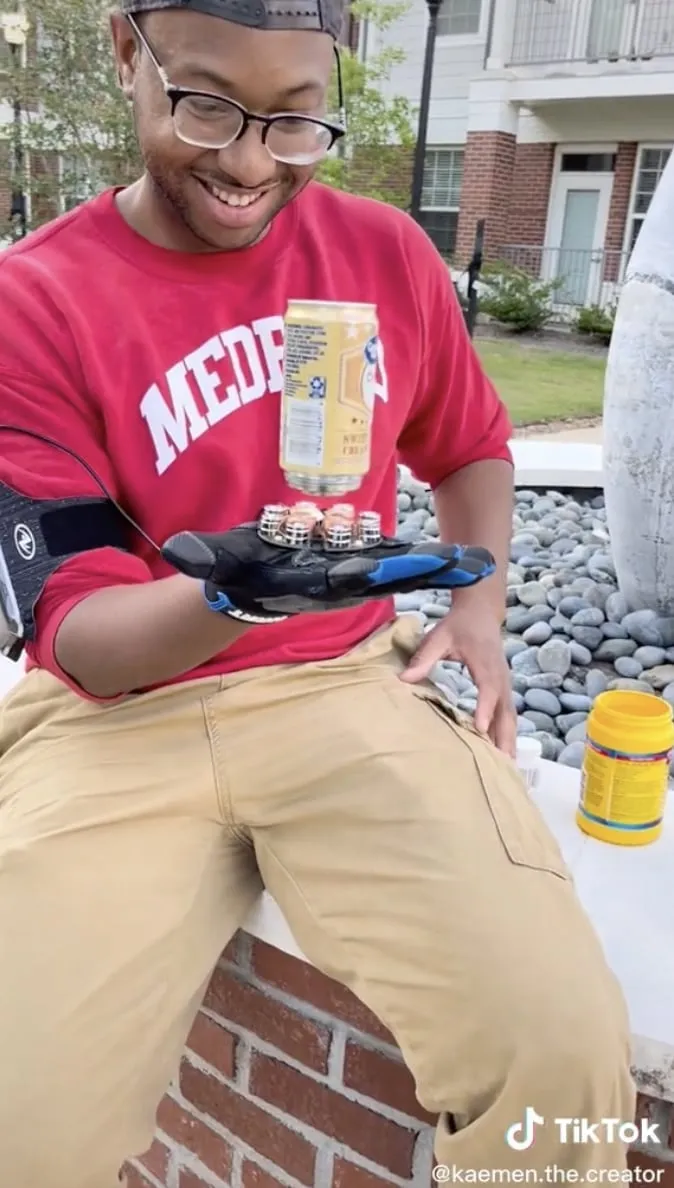
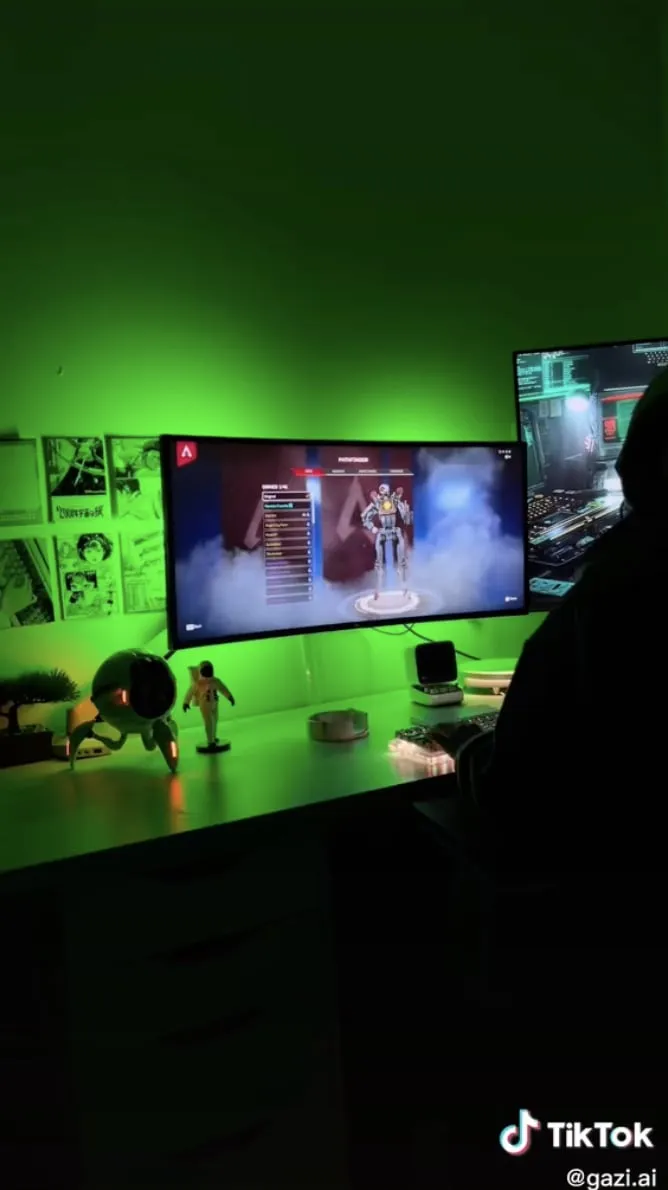
The campaign combined three TikTok posts and one dedicated YouTube video, with paid TikTok support. Student projects and gaming connected the placements. These stills show TikTok executions; YouTube delivery is documented in the recap.
TIKTOK EXECUTIONS
Reported delivery and response
- 2,810,024total video views
- 5,782paid-support clicks
NVIDIA campaign recap, September 27, 2022. The click figure covers paid support; the video-view total covers the campaign. These are different scopes, not a measured conversion funnel.
APPLY THE PRINCIPLE: Specify each platform's deliverable and next step. Keep distribution scope attached to results: campaign views and paid-support clicks answer different questions. Neither establishes purchases; dividing these totals would not produce a valid conversion rate.
Sources: NVIDIA campaign recap, September 27, 2022, slides 2-5, 10 and 13-14. Explore the NVIDIA case study. Four creators; U.S. student audience; back-to-school 2022.
Select creators and build the creative brief
The leading stated ad preferences are close: 31% authentic and relatable, 30% showing how the product works, and 29% solving a specific problem. The brief should connect a believable creator, a demonstrable benefit and a reason the audience should care.
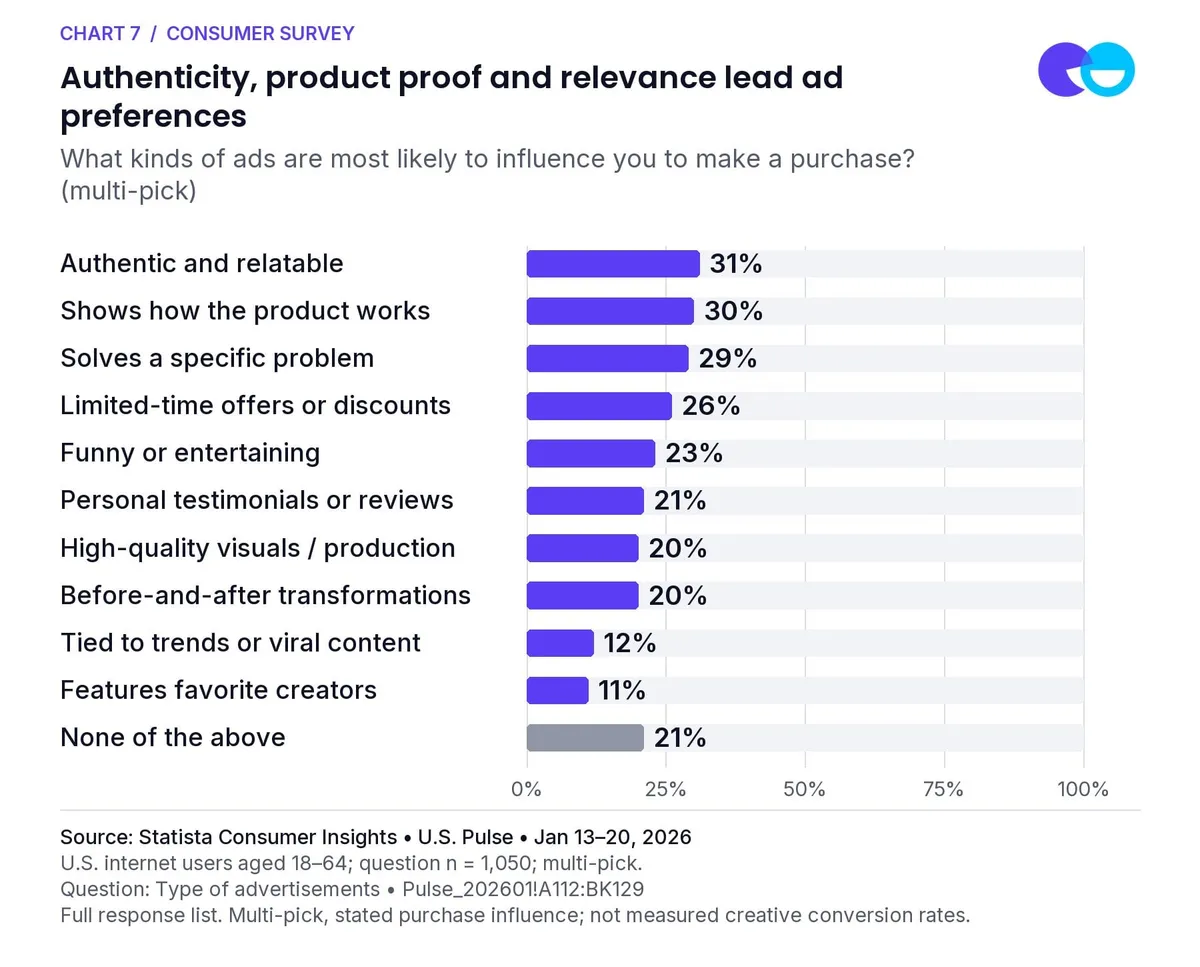
Chart 7: Authenticity, product proof and relevance lead ad preferences. What kinds of ads are most likely to influence you to make a purchase? (multi-pick). Source: Statista Consumer Insights • U.S. Pulse • Jan 13–20, 2026. Question n = 1,050; multi-pick, stated purchase influence; not measured creative conversion rates.
EVALUATE THE WORK A CREATOR CAN DO: Review audience relevance, product fit, prior explanations and the ability to show the intended use case. Ask for a concept that answers a real buying question. A follower total cannot tell you whether someone can make a confusing feature understandable.
Give creators clear inputs and room to execute
In NeoReach's separate survey of 539 creators, 77% cited time and effort as a pricing factor. Make the scope explicit: research, product testing, filming, editing, revisions and usage. These findings describe pricing considerations, not a rate card.
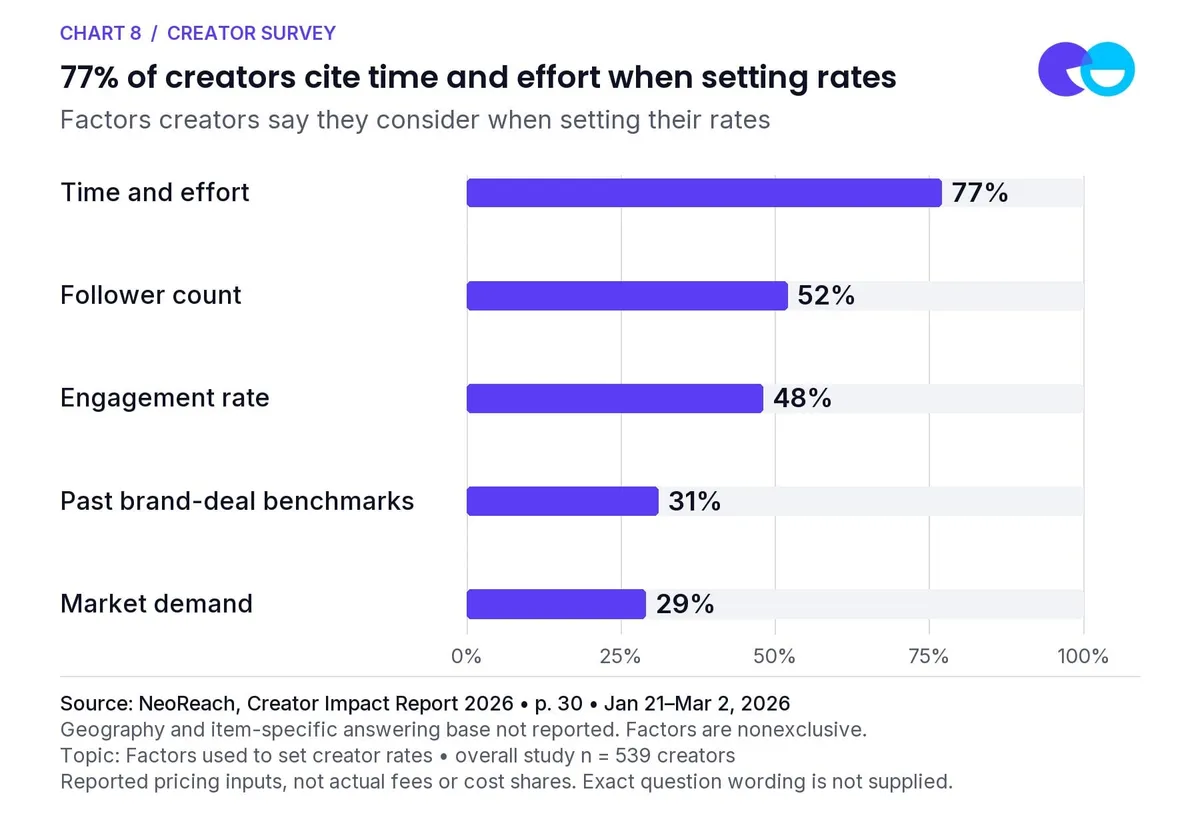
Chart 8: 77% of creators cite time and effort when setting rates. Source: NeoReach, Creator Impact Report 2026 • p. 30 • Jan 21–Mar 2, 2026. Overall study n = 539 creators. Geography and item-specific answering base not reported. Factors are nonexclusive. Reported pricing inputs, not actual fees or cost shares.
The report also states that 74% wanted creative freedom and 73% wanted clearer briefs. Exact questions and item bases are unavailable. These are directional support requests, not comparable performance measures or sales predictors.
- 74%wanted creative freedom
- 73%wanted clearer briefs
SET BOUNDARIES PEOPLE CAN WORK WITH: Brand and legal define the benefit, evidence and required information. Creators propose the opening, setting and explanation. One owner consolidates feedback before revisions become a group project.
Source: NeoReach, Creator Impact Report 2026, pp. 30 and 32. Creator survey fieldwork January 21-March 2, 2026; overall n = 539; geography and item-level bases not disclosed.
CLIO put product application inside the recommendation
For its July 2023 Prime Day campaign, CLIO worked with six beauty creators on Instagram and YouTube. Recommendations and "Get Ready With Me" content connected makeup application with the invitation to shop on Amazon. The brief emphasized waterproof, long-lasting product attributes and before-and-after demonstrations.
THE PRODUCT IN USE
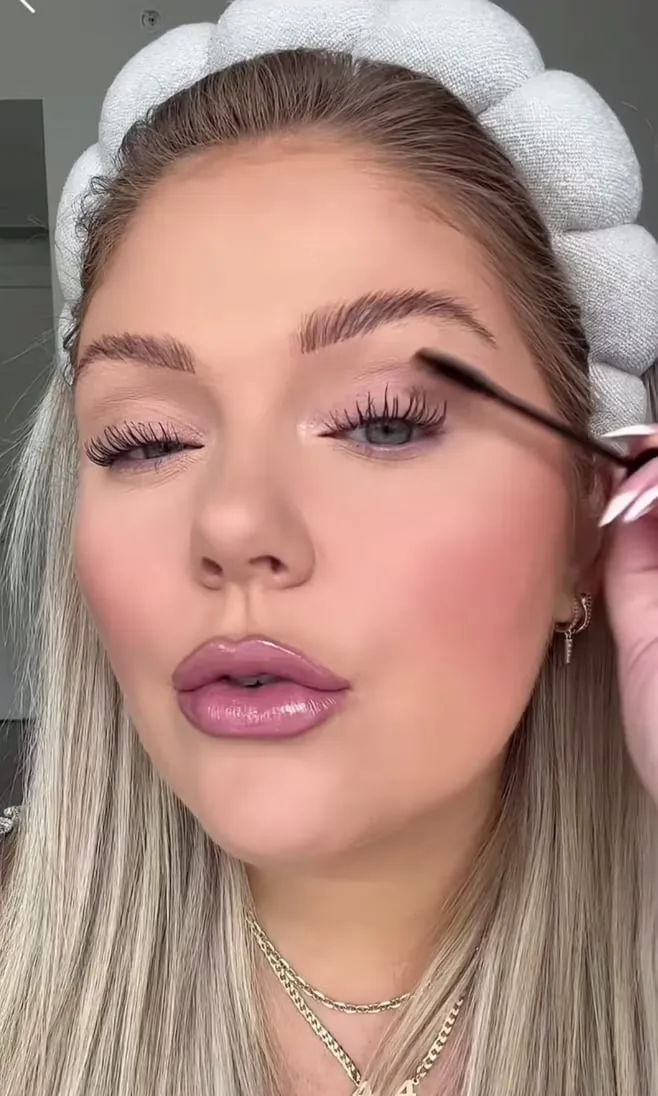
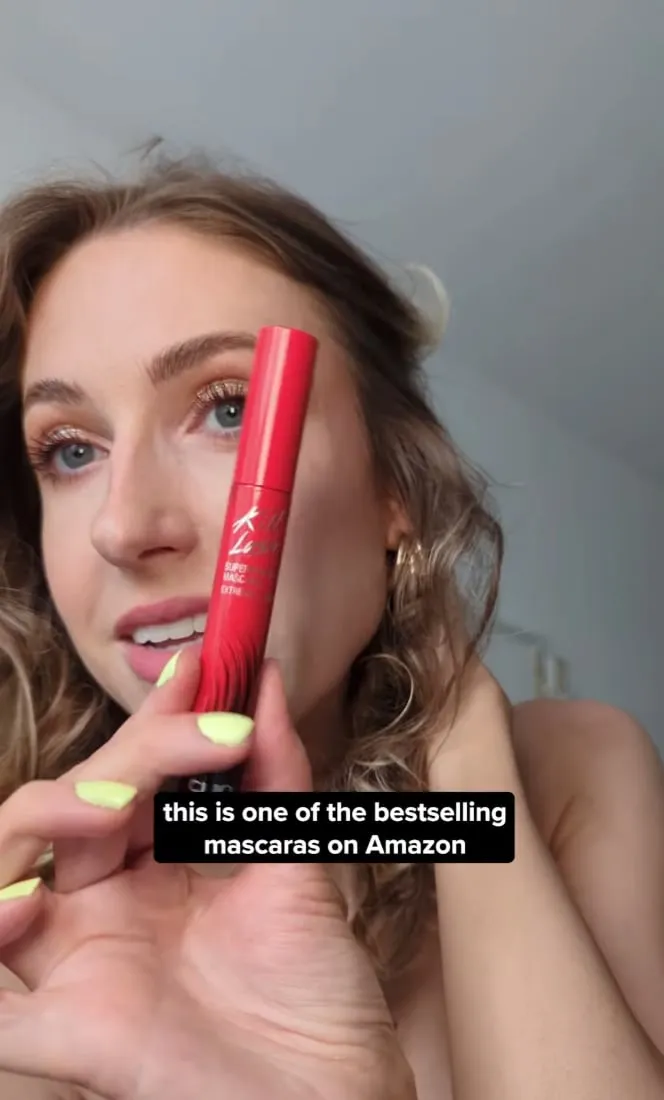
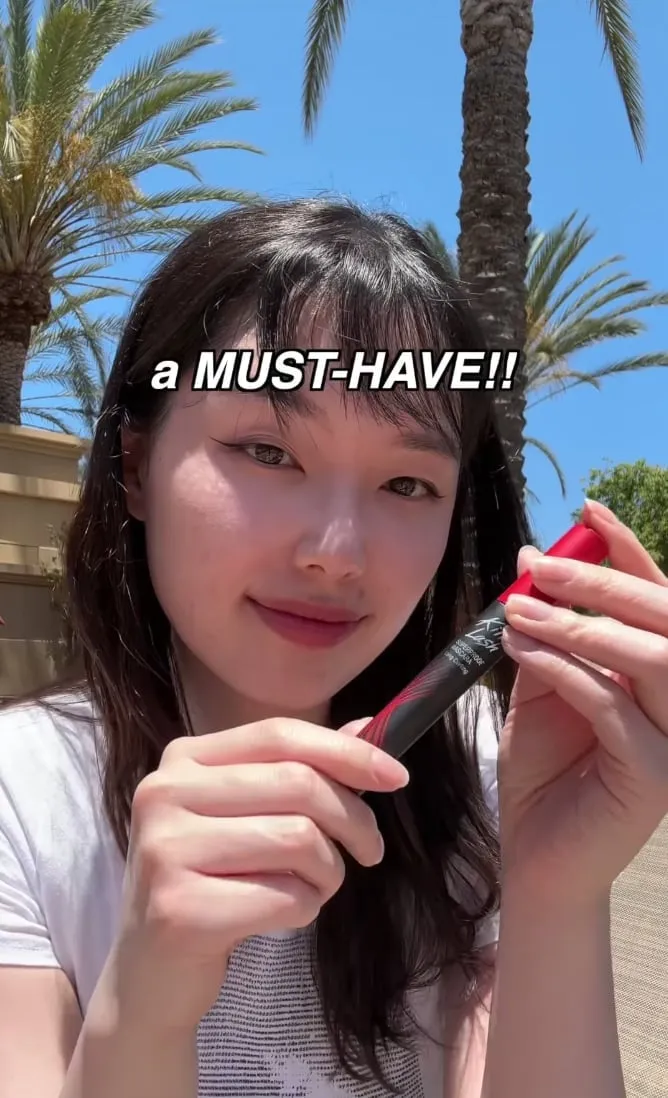
The visible execution brings a mascara wand to the lashes, giving the product a role in the content itself. It is a useful example of how a creator can explain a benefit through application. The still illustrates the execution; it does not independently substantiate the product's performance claims.
APPLY THE PRINCIPLE: Give the creator the benefit, the evidence the brand can support and the buying question to answer. Let the creator shape the routine, language and visual explanation. Evaluate the proposed demonstration before filming, so the final content can be both convincing and accurate.
Source: CLIO Instagram and YouTube campaign recap, July 2023, slides 1-8. Audience: the six selected beauty creators' audiences; no quantified demographic profile is supplied. The eight-post launch and organic results appear in Step 5.
Plan your content mix and campaign cadence
In the separate media-format question, 62% selected short videos or reels, 43% text, 40% long videos and 38% audio. The question concerns media consumption generally, so it can inform format exploration without establishing which sponsored format converts best.
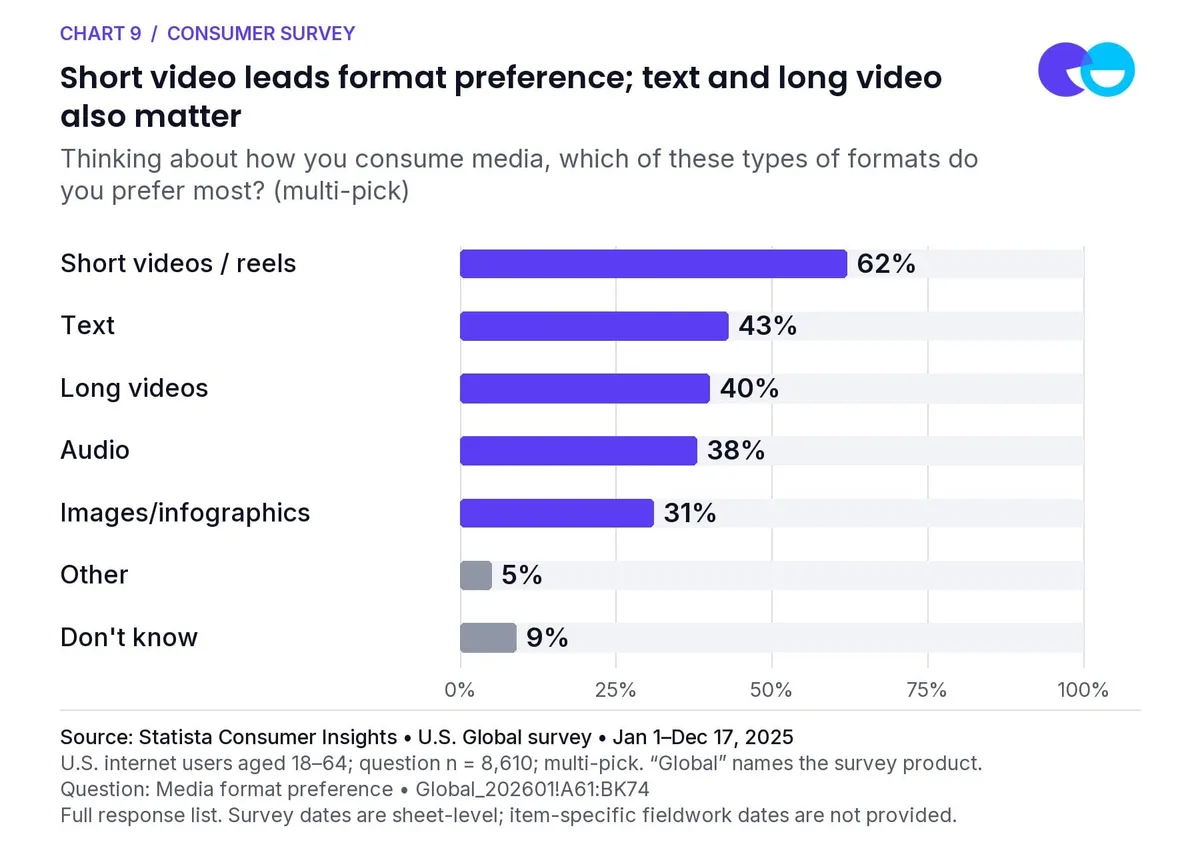
Chart 9: Short video leads format preference; text and long video also matter. Thinking about how you consume media, which of these types of formats do you prefer most? (multi-pick). Source: Statista Consumer Insights • U.S. Global survey • Jan 1–Dec 17, 2025. Question n = 8,610; multi-pick. Survey dates are sheet-level; item-specific fieldwork dates are not provided.
COMMISSION FORMATS FOR A JOB: Use a short piece to make the proposition clear, a longer explanation when the product needs detail, and supporting text where viewers need specifications or instructions. Treat this as a creative plan to test, not a finding that every campaign needs every format.
This question has 8,610 respondents. It is part of the U.S. Global survey export with 2025 fieldwork, but its exact item-level fieldwork dates are not supplied. Do not use the 60,261 platform-usage base for these percentages.
Test the ad treatment instead of assuming a winner
Asked which option they were more likely to purchase from, 32% selected a clear, direct paid ad, 16% an integrated sponsored post, 37% had no preference and 15% did not know. The largest group chose neither treatment as a preference.
Show data
Which option are you more likely to purchase something from? (single-pick) | |
|---|---|
Direct paid advertisement | 32 |
Integrated creator content | 16 |
No preference | 37 |
Don't know | 15 |
A direct ad can make the product, offer and next step immediately clear. An integration can give the product a meaningful role in a creator's story or routine. Give both an appropriate creative treatment and clear presentation of the commercial relationship. This survey does not show that direct ads convert twice as well.
WRITE A FAIR COMPARISON: Hold the proposition, offer and audience as consistent as practical while testing the treatment. Record differences in paid distribution and exposure. A rushed ad compared with a carefully produced integration is a test of those executions, not a verdict on every ad format.
Give every exposure a job
30.8% selected two to three exposures, while 36.9% did not know how many sponsored posts or ads they typically need before purchasing. That uncertainty belongs in the plan. Three commissioned posts do not guarantee three exposures to the same person.
- 30.8%selected two to three exposures
- 36.9%did not know how many sponsored posts or ads they typically need before purchasing
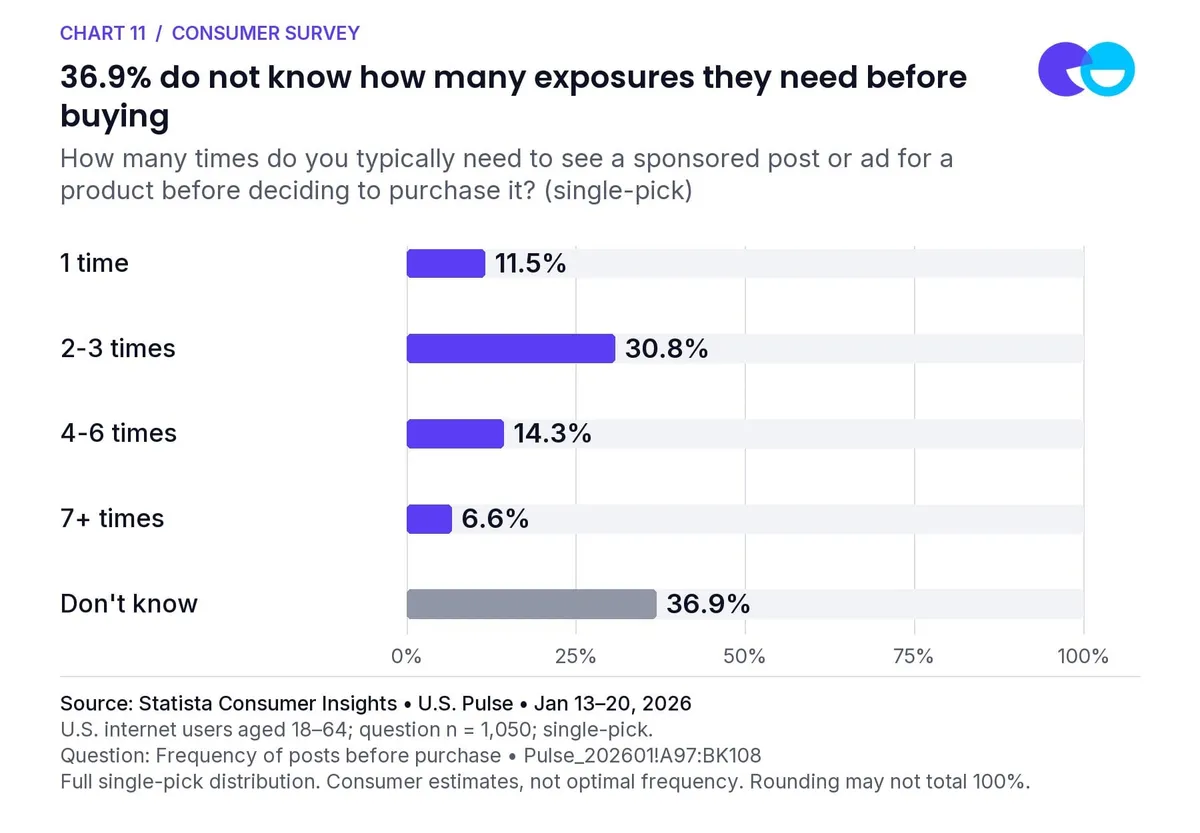
Chart 11: 36.9% do not know how many exposures they need before buying. How many times do you typically need to see a sponsored post or ad for a product before deciding to purchase it? (single-pick). Source: Statista Consumer Insights • U.S. Pulse • Jan 13–20, 2026. Question n = 1,050; single-pick. Consumer estimates, not optimal frequency. Rounding may not total 100%.
An illustrative content sequence
Role | What the audience should learn |
|---|---|
Introduction | Recognize the product and its use case. |
Demonstration | Understand the benefit through use or explanation. |
Purchase support | Find product details, availability and the next step. |
NeoReach planning recommendation. These are content roles, not a tested three-post schedule or guaranteed purchase sequence. Plan timing around the buying decision and availability.
Eight posts. One retail moment.
Six creators delivered eight Instagram and YouTube posts, logged on July 11, 2023. The coordinated Prime Day launch connected product recommendations and application content to Amazon shopping, with distinct executions around one retail moment.
ONE LAUNCH, DISTINCT EXECUTIONS
Reported organic campaign results
- 407,400organic video views
- 24,666organic engagements
Instagram: 327,400 views and 18,659 engagements. YouTube: 80,000 views and 6,007 engagements. No Amazon purchase count is reported.
APPLY THE PRINCIPLE: Align publishing with the commercial moment. This launch burst does not prove repeated individual exposure or a frequency effect on purchases. To test cadence, define the comparison before launch and measure exposure where possible.
Source: CLIO Instagram and YouTube campaign recap, July 2023, slides 2-8. This Prime Day campaign is separate from CLIO's earlier TikTok campaign; their results are not combined.
Build the path from discovery to purchase
The timing question asked, "When you buy from a creator's recommendation, how soon do you usually make the purchase?" Immediately and within a day together account for 21.6% of all respondents. About 23% selected within a week, and 14% longer than a week.
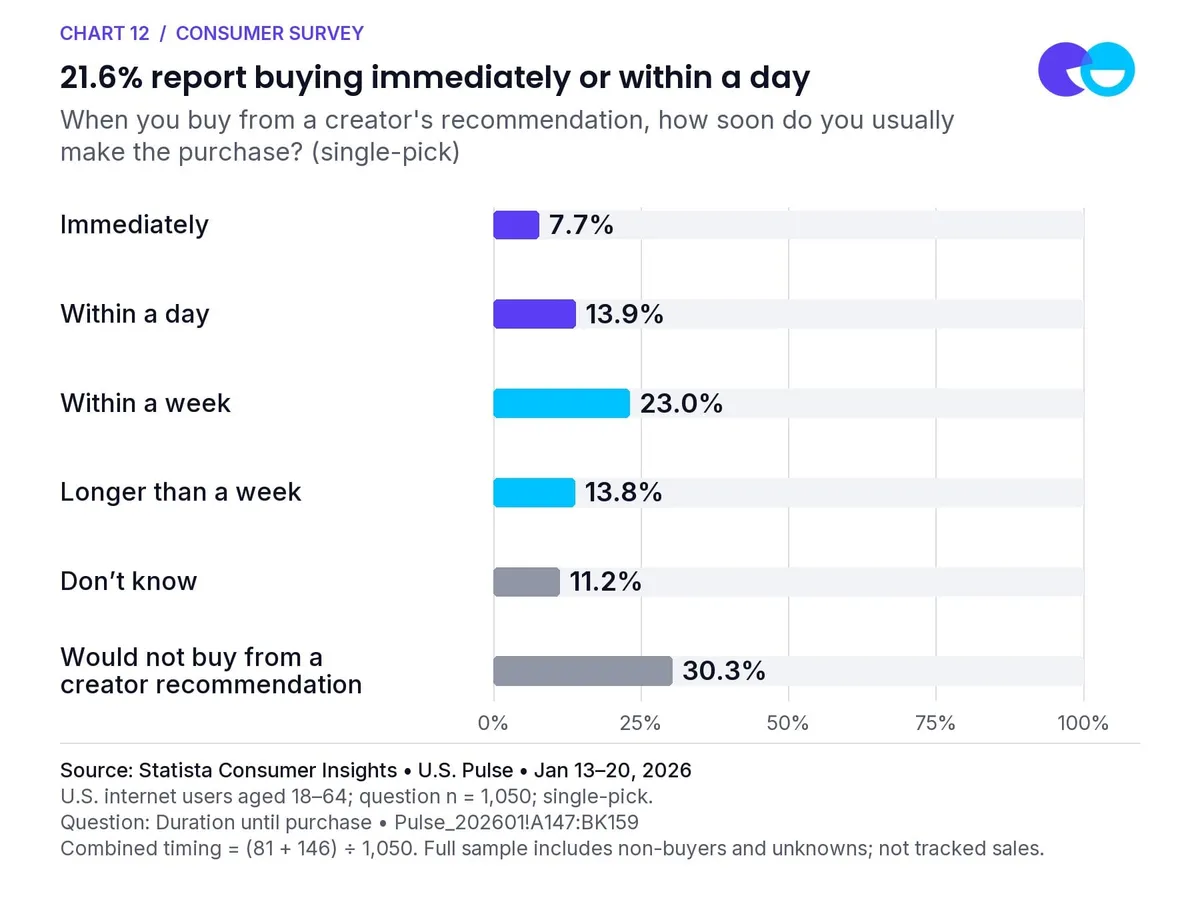
Chart 12: 21.6% report buying immediately or within a day. When you buy from a creator's recommendation, how soon do you usually make the purchase? (single-pick). Source: Statista Consumer Insights • U.S. Pulse • Jan 13–20, 2026. Question n = 1,050; single-pick. Combined timing = (81 + 146) ÷ 1,050. Full sample includes non-buyers and unknowns; not tracked sales.
SUPPORT BOTH IMMEDIATE AND CONSIDERED DECISIONS: Prepare product details, links and availability before launch; keep them accessible afterward. Choose the reporting window around your business decision and measurement design. This chart does not establish a universal window.
The chart retains respondents who would not buy and those who did not know. These are self-reported timing answers, not transaction logs, a measured conversion funnel or a forecast of how quickly your campaign will sell.
Pair the recommendation with useful purchase support
45% selected discounts or promotions, 35% clear product information and reviews, and 21% customer testimonials or success stories as brand behaviors making them more likely to buy. Multiple selections were allowed; these are complementary possibilities to test.
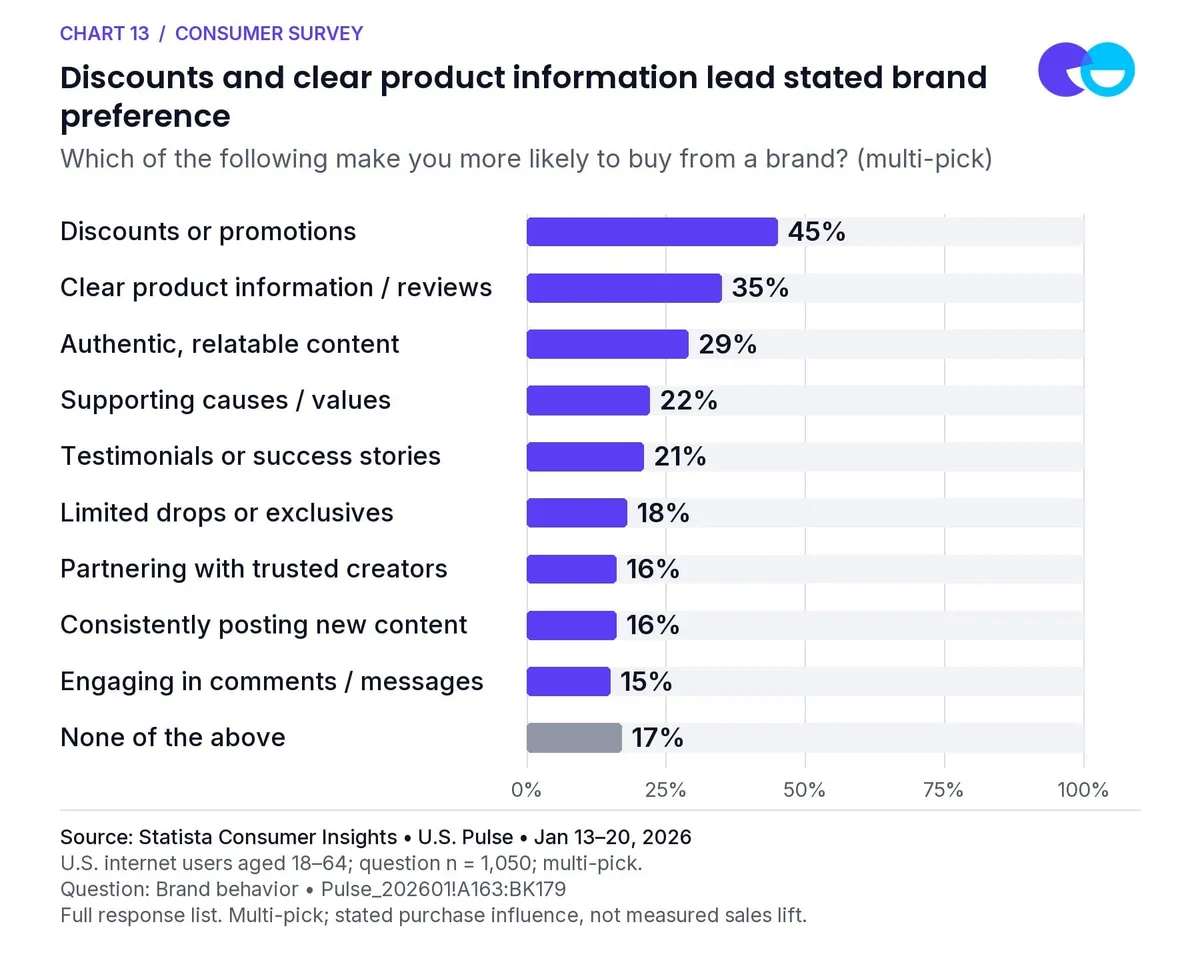
Chart 13: Discounts and clear product information lead stated brand preference. Which of the following make you more likely to buy from a brand? (multi-pick). Source: Statista Consumer Insights • U.S. Pulse • Jan 13–20, 2026. Question n = 1,050; multi-pick; stated purchase influence, not measured sales lift.
PROTECT THE PROPOSITION AND THE ECONOMICS: Brand and finance should assess margin, eligibility and positioning before approving an offer. Ecommerce and retail should verify the destination, product details, stock, pricing and terms.
Premium brands may start with product explanation or reviews. Test the buying experience; stated preference alone cannot establish the most profitable intervention.
Sam's Club showed the next step
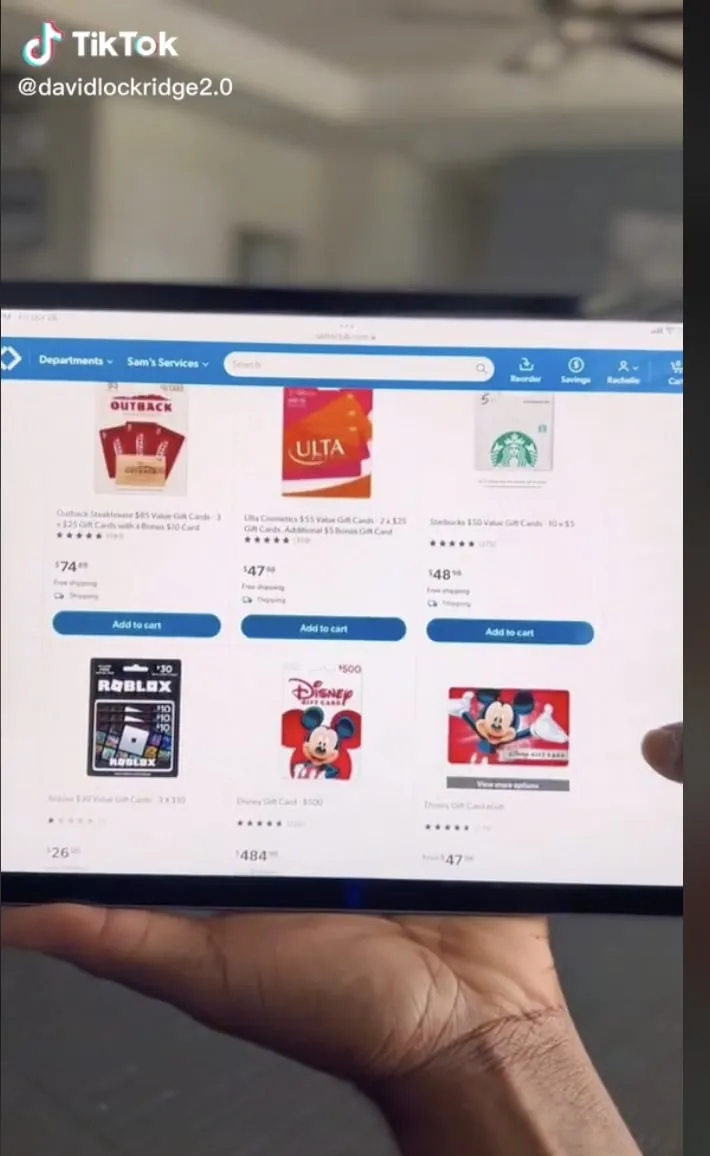
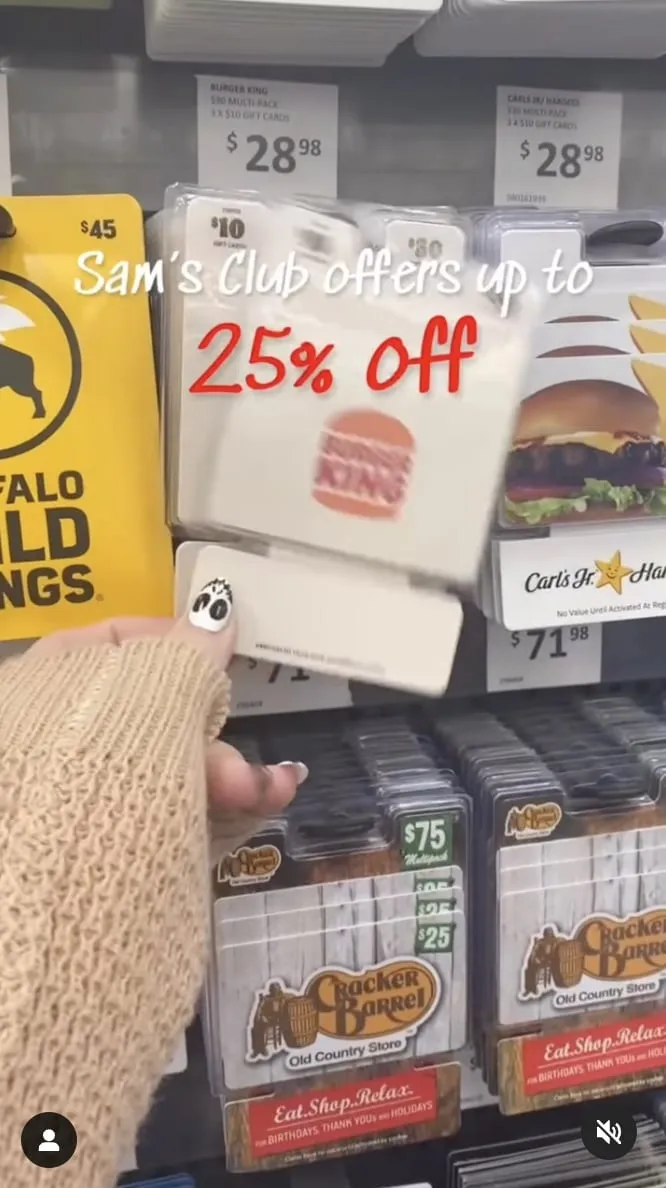
For holiday 2022, 15 creators explained discounted Sam's Club gift cards: eight in-store and seven online executions. Family, crafting, home, lifestyle and gaming creators chose relevant gift-card brands while retaining the savings and gift-giving messages.
TWO DOCUMENTED SHOPPING ROUTES
Reported campaign delivery
- 2,534,200impressions
- 15,074engagements
Posts ran November 3-December 16, 2022. The recap includes Instagram, TikTok and one YouTube Short. No tracked purchase total is supplied.
APPLY THE PRINCIPLE: Show where to find the product, what the offer means and how to act. Online and in-club executions answer different practical questions. These delivery results do not establish sales or incremental demand.
Sources: Sam's Club campaign recap, December 2022, slides 1-7. Explore the Sam's Club case study. The brief targeted members and the selected creators' audiences. This is the holiday 2022 campaign.
Set your budget, measurement and testing plan
The workbook does not establish an optimal budget, expected ROAS, creator fee benchmark or ideal attribution window. This step is NeoReach's recommended planning framework: connect the investment to a business question, define the evidence required and agree on what would justify the next decision.
Build the full program cost
Cost area | What the plan should specify |
|---|---|
Creator compensation | Deliverables, preparation, product testing, revisions and payment terms. |
Production and fulfillment | Product, shipping, locations, editing and any required support. |
Usage and adaptations | Channels, duration, versions and permissions for paid or owned use. |
Paid distribution | Audience, placements, test structure and delivery controls. |
Measurement | Tracking, research, comparison design and analysis responsibilities. |
Operating capacity | Approval owners, scheduling, contingency and coordination work. |
NeoReach planning recommendation. No standard cost split or industry fee benchmark is implied.
Procurement and marketing should compare equivalent scopes. A lower quote with different usage rights or production requirements may represent a different purchase. The creator-survey finding on time and effort supports a detailed scope discussion; it cannot supply your rate assumptions.
SET THE ECONOMIC RULE BEFORE LAUNCH: For an acquisition objective, finance should approve the margin and payback assumptions behind an acceptable acquisition cost. Define whether revenue includes discounts, returns and cancellations. Report media-only costs separately from full program costs so the team can interpret the result.
Measure each stage with the right evidence
A useful measurement plan separates delivery, audience response, business outcomes and incremental impact. The stages answer different questions. Views and engagements can describe useful campaign activity, but neither is a substitute for sales or profit.
The measurement plan
Stage | Evidence to define | What it answers |
|---|---|---|
Delivery | Published content, impressions, video views and reach, with platform definitions. | Did the work run and what exposure did it receive? |
Audience response | Comments, shares, saves, qualified clicks and relevant site behavior. | How did people respond and where did interest continue? |
Business outcomes | Completed purchases, revenue, qualified leads or retail actions, with an agreed window. | Which commercial outcomes were observed or attributed? |
Incremental impact | An appropriate randomized holdout or credible comparison, designed before launch. | What changed beyond what would otherwise have happened? |
NeoReach planning recommendation. Keep paid, organic and combined metrics separate. Do not add reach, views and impressions into one exposure total.
GIVE THE TEST A DECISION IT CAN CHANGE
Compare one actionable question: an audience priority, placement, creative approach or purchase destination. Record the hypothesis, primary result, comparison conditions and reasons the test could be inconclusive. Keep other conditions as consistent as practical and document remaining differences.
AGREE THE REVIEW RULES: Expand when the approved objective, economics and evidence support it. Revise a specific message or buying experience when the results identify a weakness. Pause expansion when tracking is unreliable or costs exceed the limits agreed for the test. Keep weak executions in the record.
InBody makes the attribution question concrete
InBody's 2024 program paired creator-led product content with paid distribution to build awareness and support sales among health and fitness audiences. The campaign records include Instagram Reels, TikTok videos and Meta ads. Its wrap reports 1,597 attributed sales over ten months.
CREATOR CONTENT FROM THE SUPPLIED CASE STUDY
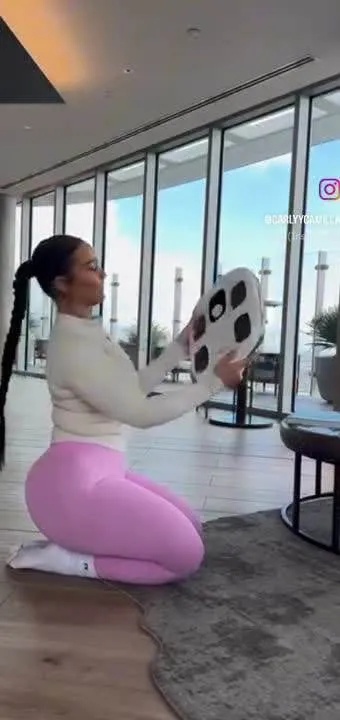
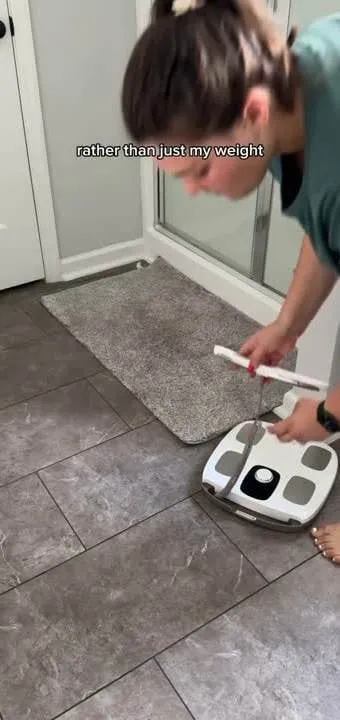
That sales figure is source-reported and was not reconciled to an order-level export. Supporting records mix store sales with modeled attributable sales. The wrap also reports a last-30-days snapshot, but its exact cutoff is unavailable and it overlaps the campaign period. It must not be added to the ten-month figure.
APPLY THE PRINCIPLE: Require an agreed attribution definition, reporting window and reconciliation to business records. Separate platform-reported conversions, affiliate conversions and orders before calculating returns. Attributed sales describe a measurement claim; an incremental sales claim needs an appropriate comparison.
Sources: InBody 2024 Campaign Wrap & 2025 Strategy, paragraphs 12-21; shared campaign workbook; InBody Case Study, p. 1. Explore the InBody case study. Later strategy projections are excluded from the historical results.
Assemble the campaign brief before you approve the plan
The output of this report should be a brief your teams can execute and evaluate. Resolve these decisions together before committing the full program. Each line needs an accountable owner and an answer specific to your brand.
The 2027 planning checklist
Decision | Owner | Required answer |
|---|---|---|
1. Objective and audience | Brand director | Business result, priority audience, intended action and working hypothesis. |
2. Category and proposition | Brand and insights | Customer need, product benefit and purchase barrier worth testing. |
3. Placements and distribution | Media lead | Creator placements, paid support, permissions and rationale. |
4. Creator fit and brief | Influencer and creative | Selection criteria, supporting evidence and choices the creator owns. |
5. Content and cadence | Campaign manager | Deliverable roles, dependencies, feedback owners and publishing responsibilities. |
6. Purchase experience | Ecommerce or retail | Destinations, information, availability, offer terms and tracking. |
7. Budget and decisions | Finance and measurement | Full costs, definitions, comparison design, review window and decision rules. |
NeoReach planning recommendation.
BEFORE THE LAUNCH MEETING: Walk the consumer journey on a phone. Confirm that the brief, creator execution, product availability, landing experience and measurement setup describe the same proposition. A strong recommendation deserves a working next step.
Research methodology and interpretation
PRIMARY CONSUMER RESEARCH
The primary source is the supplied Statista Consumer Insights export dated January 29, 2026. Its Pulse_202601 tab covers 1,050 U.S. internet users aged 18-64, fielded January 13-20, 2026 and current as of January 21. All ten influencer questions in that tab state a base of all respondents. Generation groups are Gen Z, n = 315; millennials, n = 350; Gen X, n = 315; and Baby Boomers, n = 70. Gender comparisons use women, n = 530, and men, n = 520.
The Global_202601 tab contains U.S. data collected in four waves from January 1 to December 17, 2025, current as of December 19. Regular platform usage uses n = 60,261. Media-format preference has its own question base of n = 8,610. The workbook does not supply that item's exact fieldwork window within the broader survey period. "Global" names the survey product; these results concern the United States.
SEPARATE CREATOR RESEARCH
Creator findings come from the supplied Creator Impact Report 2026, which describes NeoReach's survey of 539 creators, fielded January 21-March 2, 2026. Geography and item-specific bases are not disclosed. Creative-freedom and clearer-brief percentages are report-level callouts with the exact questions unavailable. They are qualified in the report and are not treated as measured performance effects.
HOW THE FIGURES WERE CALCULATED
The workbook contains aggregate cross-tabs, not respondent-level records. Derived shares use counts divided by the matching question or demographic base. At least one monthly purchase is 470/1,050 = 44.8%. At least one influenced action is (1,050 - 474)/1,050 = 54.9%, using the complement of "none." Immediate or within-a-day timing is (81 + 146)/1,050 = 21.6%. The monthly index is the unrounded group share divided by the unrounded overall share, multiplied by 100.
Sources: Statista workbook, Pulse_202601!A181:A187 and Global_202601!A126:A132; question bases and cells are recorded beneath figures and in the internal calculation audit. Creator Impact Report 2026, pp. 6-7, 24, 30 and 32.
Read the evidence at the level it supports
These are 2025 and 2026 research inputs for a 2027 strategy, not 2027 survey results or predictions. The consumer population is U.S. internet users within the documented age range. The small Baby Boomer group does not represent the entire older population. The workbook does not document weighting, margins of error or significance tests; demographic differences are descriptive.
Multiple-response questions allow overlapping selections. Single-response distributions retain every response option, including uncertainty and non-purchase answers. Whole percentages are rounded for readability; the full timing and frequency charts use one decimal and may sum to 99.9% or 100.1%. Separate survey samples are never combined into one respondent total, and separate questions are not assembled into a measured funnel.
Where interpretations differ, the workbook governs consumer claims. Its 18-64 age scope replaces the older PDF's age description. Monthly purchase totals are recalculated from counts rather than added rounded percentages. The purchase-timing question asks about usual behavior and includes a non-buying option; it is presented as self-report, not observed transactions or a conversion rate.
CAMPAIGN EVIDENCE AND RECOMMENDATIONS
Five case studies were selected from NeoReach's supplied campaign library and official case-study pages. Each example preserves the client, campaign context, metric definitions and available timeframe. Original campaign stills illustrate execution; they are not survey observations. Campaign-attributed results do not establish incremental impact without an appropriate comparison.
The planning frameworks, example content sequence and decision rules are NeoReach recommendations to test. The research does not provide optimal budgets, fee benchmarks, ROAS forecasts or universal attribution windows. The source notes identify the evidence supporting each chart or case.
Additional workbook tabs Pulse_202511 and Media_202512 were inspected but are not used for the report's quantitative findings. Their samples and periods are not pooled with the included questions.
PLAN THE NEXT DECISION: Request a creator strategy briefing for your brand.