What consumers say, what creators experience, and what brands can do next.
Key highlights
- 69%of Gen Z buy from creator recommendations each month
- 47%of Gen Z discover creator-recommended products through TikTok
- 52%say they need at least two product exposures before buying
- 45%say discounts or promotions make them more likely to buy
Your audience can like a creator, enjoy a post and still leave the product in the cart.
For marketers, the interesting question is what helps a recommendation become a decision: the right person, a useful demonstration, a familiar context, another encounter, a better offer. Usually, you are planning several of those things at once, with a launch date staring back at you.
The Creator Impact Report 2026 gives that planning conversation some substance. It combines a Statista survey of 1,050 U.S. adults with a NeoReach survey of 539 creators, offering perspectives from both sides of the feed. This report turns its findings into decisions about audience, distribution, creative, repetition and partnerships.
You will also see campaign examples from NeoReach's portfolio. These show how different creative approaches look in practice; they are separate from the survey research. The goal is to help you build a stronger brief and a more useful measurement plan. Bring the numbers to the meeting. Give the creators something worth making.
55% of consumers have acted on a creator recommendation
Creator influence can show up long before an ecommerce receipt. In the consumer survey, 55% reported taking at least one real-world action after a creator recommendation. That figure covers several kinds of action, including trying food and purchasing. It describes reported influence across those behaviors, rather than an attributed purchase conversion rate.
The most reported individual action was trying a new restaurant or food item, selected by 31%. That makes the finding especially useful for marketers whose outcomes happen across stores, venues and online channels. A viewer might remember a meal when choosing where to eat. They might look for an ice cream brand during a grocery trip. A short video can supply the idea; the eventual decision can happen somewhere else.

55% | Consumer survey: report acting on a creator recommendation. At least one real-world action reported by surveyed consumers. Consumer survey • January 2026 • study sample: 1,050 U.S. adults. |
31% | tried a new restaurant or food item. Of all surveyed consumers. Multi-select, retrospective self-report. Item-level response base not disclosed. |
For your next brief, name the action precisely. “Drive influence” leaves almost every production decision open. “Make this product easy to recognize on the shelf” gives the creator something to work with. So does “show why this location fits a late-night plan” or “explain the feature that makes someone consider switching.” Specificity helps you judge whether a concept gives the audience enough information to act.
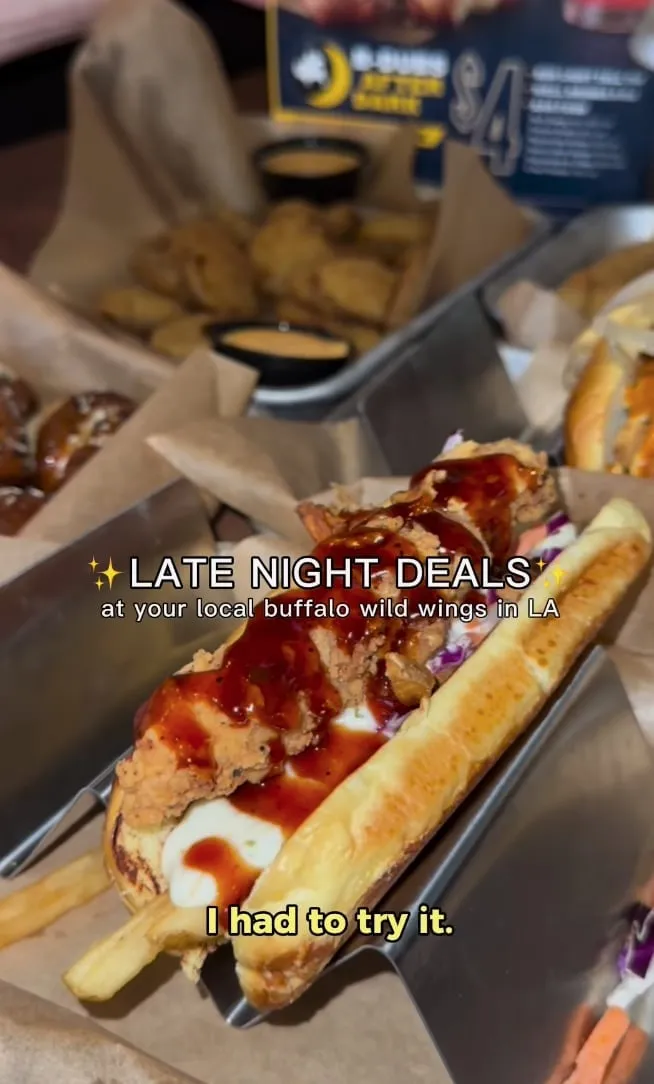
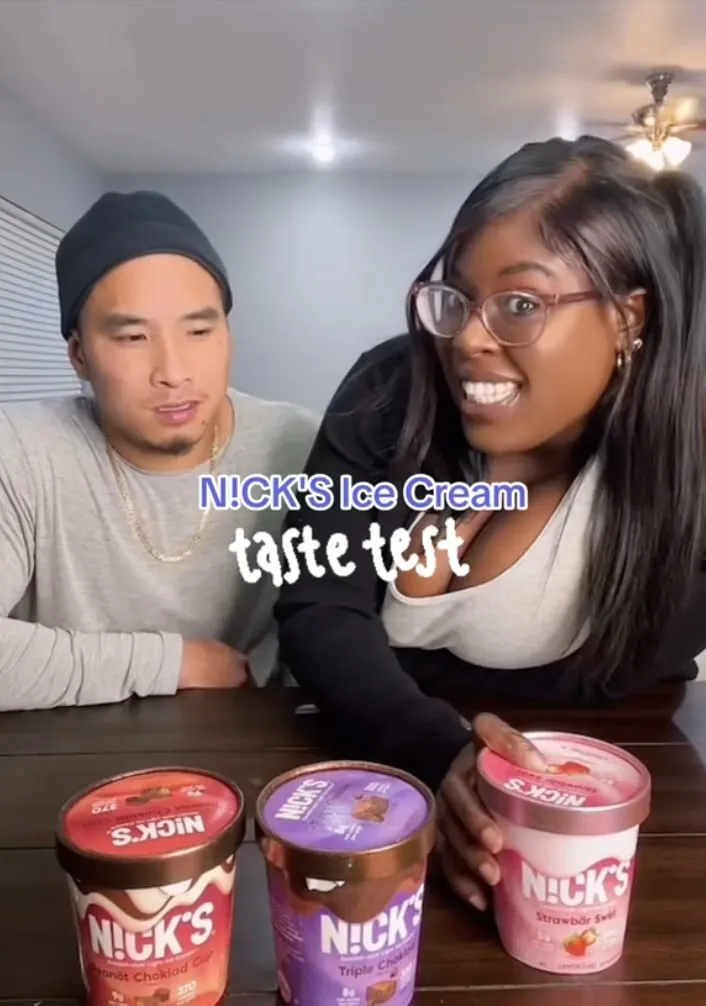
The Buffalo Wild Wings and N!CK'S examples make the creative opportunity tangible. Food is visible, recognizable and connected to a consumption moment. That is a useful starting point for discussing product prominence, sensory detail and occasion. The stills cannot establish what anyone bought, but they can help a team discuss whether the product and use case are immediately clear.
Campaign in practice: food and occasion
GIVE THE RECOMMENDATION SOMEWHERE TO GO
Work backward from the next step. A restaurant campaign may need an accurate location, opening hours or an offer someone can remember. A packaged food campaign may need recognizable packaging and clear availability. A software campaign may need a credible explanation followed by a usable trial path. The survey does not rank these execution choices; they are practical ways to make the intended action easier to understand.
Then agree on evidence before publishing. For online journeys, that may include tagged visits, product-page behavior and attributed purchases. For retail or restaurant work, it may involve redemption data or a research design that compares relevant locations or audiences. The appropriate method depends on what the brand can measure reliably. Choose it before the wrap report turns into a creative writing exercise.
Also allow for more than one useful response. Saves and questions can tell you what viewers want to revisit or understand, even when they are not sales. Keep those signals visible, with their own labels, while your commercial reporting answers the harder question. The strategic opportunity in the 55% finding is broad, but your campaign objective should be concrete enough that everyone knows what success means.
69% of Gen Z buy from creator recommendations each month
Across all surveyed consumers, 45% reported buying at least one item each month based on creator recommendations. The generational breakdown changes the planning conversation: 69% of Gen Z, 50% of millennials, 24% of Gen X and 11% of boomers reported this monthly behavior. These are shares within each surveyed generation, not each generation's contribution to total sales.
The research therefore gives a stronger signal of recurring creator-led shopping among its younger respondents. It does not tell us what they spent, how profitable those purchases were or whether the creator introduced a brand they otherwise would not have considered. Frequency is useful. Your finance team will still want the rest of the story.
Show data
Buy at least one item monthly | |
|---|---|
Gen Z (study n = 315) | 69 |
Millennials (study n = 350) | 50 |
Gen X (study n = 315) | 24 |
Baby Boomers (study n = 70) | 11 |
BUILD THE AUDIENCE PLAN AROUND A BUYING SITUATION
If Gen Z is central to your growth plan, creator recommendations deserve serious consideration as part of the buying journey. The 69% finding supports taking that role seriously, then investigating which creators, categories and product needs are relevant to your customers. An age label alone is a thin creative brief. A student researching a laptop and a young parent choosing a toy may both use creators while needing very different information.
For millennials, the 50% result is also substantial. Avoid building an influencer strategy that assumes only the youngest consumers act on recommendations. Map the buying situations your product serves, then identify the creators who can discuss those situations credibly. Their audience's interests, purchasing context and questions matter alongside age. The practical task is to connect the recommendation to a need someone recognizes.
For Gen X and boomers, lower reported monthly purchase frequency suggests a different starting point for testing. It does not establish that creators are irrelevant to those customers. They may have different discovery habits or require different information, but this survey cannot establish why the gap exists. Begin with the channels and decision stages your customer research supports, and assess whether creators improve those specific experiences.
The sample sizes also matter when comparing the percentages. Gen Z and Gen X each included 315 respondents, millennials 350, and boomers 70. The boomer result comes from a smaller group and deserves correspondingly cautious interpretation. These findings describe the surveyed adults; they are not a census of every generation's shopping behavior.
TURN THE DIFFERENCE INTO A TESTABLE PLAN
A useful planning exercise is to write a separate hypothesis for each priority audience. For example, a product demonstration may help a younger discovery audience understand a feature, while a more detailed explanation may suit customers already comparing options. Those are hypotheses to test with your audience, not effects established by the generation chart. Make the distinction explicit when asking for budget.
Use audience-specific objectives and compare like-for-like outcomes. A campaign built to generate product discovery should be evaluated against that job, while a purchase campaign needs commercial measures and an appropriate attribution window. The generational statistics can shape where you investigate. They cannot set your expected return. That comes from your own campaign results, product economics and the quality of the test you run.
47% of Gen Z discover creator-recommended products through TikTok
Discovery is not evenly distributed across the feed. Among Gen Z respondents, 47% selected TikTok videos and 42% selected Instagram Stories as places where they discovered creator-recommended products. Respondents could select multiple channels, so the two figures overlap. They are not pieces of a platform market-share pie, and they do not mean that TikTok delivered 47% of purchases.
The useful implication is that discovery can happen in more than one format for the same person. Your audience might first notice a product in a short video and later encounter an explanation in Stories. The survey does not track that sequence, but it gives a reason to investigate how your own audience moves between the formats you are considering.
Show data
Selected discovery routes for creator-recommended products | |
|---|---|
TikTok videos | 47 |
Instagram Stories | 42 |
Across the full consumer sample, the report states that 31% discovered creator-recommended products through YouTube video descriptions, 28% through TikTok videos and 25% through Instagram Stories. These answers could also overlap. The overall figures give your channel discussion a wider frame than the Gen Z results alone. For a product that needs explanation, investigate whether a longer video and a useful description can support that task. For a quick demonstration, investigate the shorter formats your audience uses. Let the buying question guide the format test, then assess the outcome with your own campaign data.
For an enterprise team, channel planning should connect three decisions: who needs to see the product, what the content must explain and what happens after someone becomes interested. A creator's platform presence helps answer the first question. Their ability to make a particular format useful helps answer the second. Your landing experience, availability and follow-up help answer the third. A large audience cannot make a confusing next step clear.
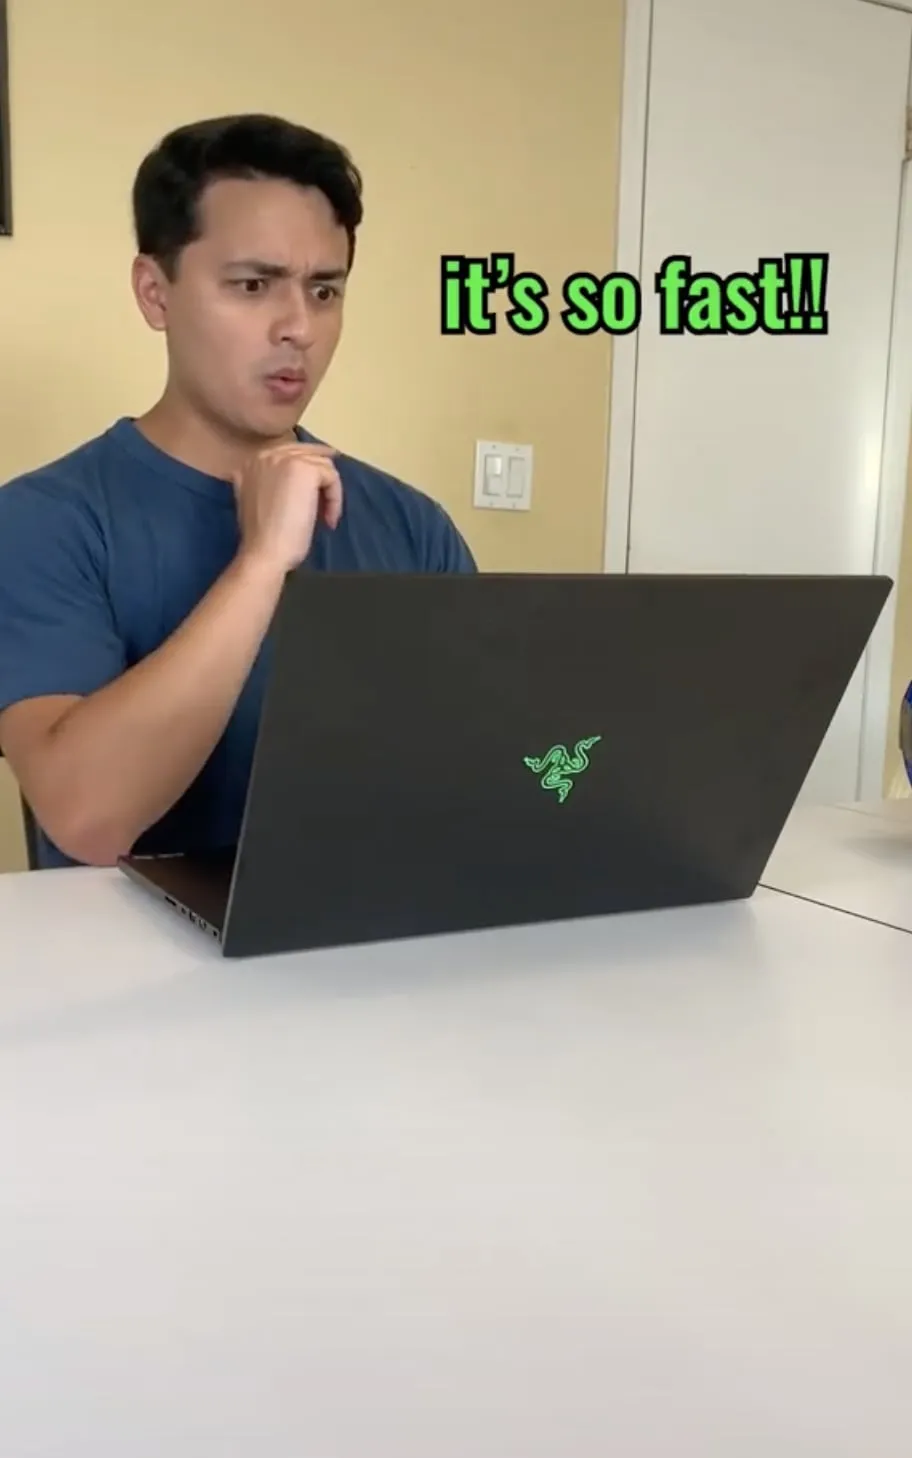
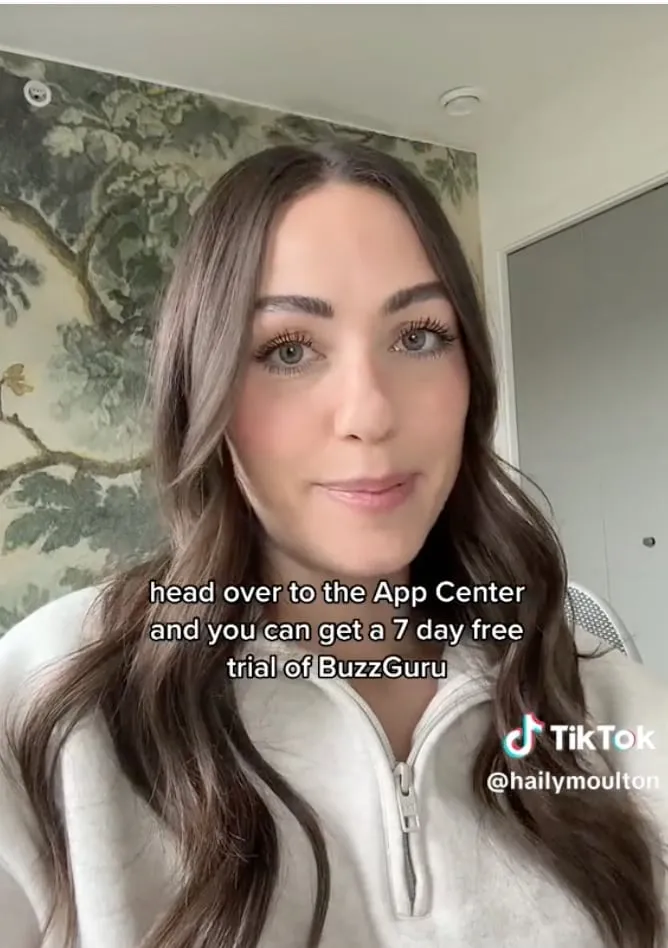
The NVIDIA back-to-school campaign provides a relevant creative reference: the laptop appears in the content, allowing the product to become part of a recognizable setup. The BuzzGuru still shows a visible trial invitation. Together, they illustrate two different jobs within a discovery journey: giving the product context and making the next step visible. They do not establish which platform converted better.
Campaign in practice: context and next steps
LEAVE ROOM FOR AUDIENCES OUTSIDE THE OBVIOUS CHANNELS
Another finding deserves space beside the TikTok headline. The report states that 47% of Gen X respondents and 67% of boomers discovered products through none of the listed creator channels. This answer refers to the options in that survey question. It does not mean those respondents never encounter creator content, never shop online or never respond to recommendations.
- 47%Chart 4 / Consumer survey — Gen X: reported none of the listed creator discovery channels. Report narrative finding. Gen X study n = 315.
- 67%Baby Boomers: reported none of the listed creator discovery channels. Report narrative finding. Baby Boomers study n = 70. Reported for the listed creator channels; this does not describe every way people discover products.
For marketers, it is a reminder to check the audience before copying a channel mix. A plan designed around younger respondents' discovery habits may leave important customers poorly served. Review your own search, site and customer research, and ask where people in the target buying situation seek help. Then decide whether a creator belongs at discovery, comparison, reassurance or another useful point in that experience.
Brief the format intentionally. A Story needs a clear progression and a readable action. A longer product video has room for explanation, questions and detail. A short demonstration needs the essential action to be understood quickly. These are creative planning choices, not a ranking of format performance from this survey. Adapt the execution to its job rather than uploading one asset everywhere and calling it a distribution strategy.
Before launch, walk the path as a viewer. Check the product name, the destination, the mobile page and the offer details. If the creator makes someone curious, the next experience should reward that curiosity. Discovery is an opportunity to earn consideration. The follow-through is part of the campaign, even when another team owns the page.
59% would buy on a creator recommendation
59% of surveyed consumers indicated that they would buy a product based on a creator recommendation, selecting a purchase timeframe in the survey. That is a meaningful indication of openness. It is also a statement about what respondents say they would do, rather than an observed checkout result. Use it to understand the opportunity; measure your own campaign to understand what you captured.
- 59%Chart 5 / Consumer survey: said they would purchase after a creator recommendation. Reported purchase intention. Not a measured conversion rate. Consumer survey • January 2026 • study sample: 1,050 U.S. adults.
The distinction becomes useful when someone asks for a conversion forecast. Survey willingness cannot supply that forecast on its own. A person's eventual decision will involve the product, price, availability and buying situation, none of which is held constant by this headline figure. Your brand needs a measurement plan that follows the actual journey from exposure or engagement to the outcome you intend to improve.
Sponsored content adds another perspective. 33% of all respondents said they were likely or extremely likely to buy from a sponsored post, compared with 49% of Gen Z. That is a 16 percentage point difference between the reported figures. Gen Z is included within the overall sample, so this is a descriptive comparison with the full survey, not a comparison between two independent groups.
Show data
Selected “likely” or “extremely likely” to purchase | |
|---|---|
All surveyed adults | 33 |
Gen Z | 49 |
GIVE INTEREST ENOUGH INFORMATION TO BECOME CONSIDERATION
For your creative brief, the practical question is what an interested viewer still needs to know. Can they identify the product? Do they understand the benefit? Is there a specific use case? Can they find the relevant details without hunting through an unrelated page? A persuasive recommendation can open the conversation. Your content and customer experience need to carry it forward.
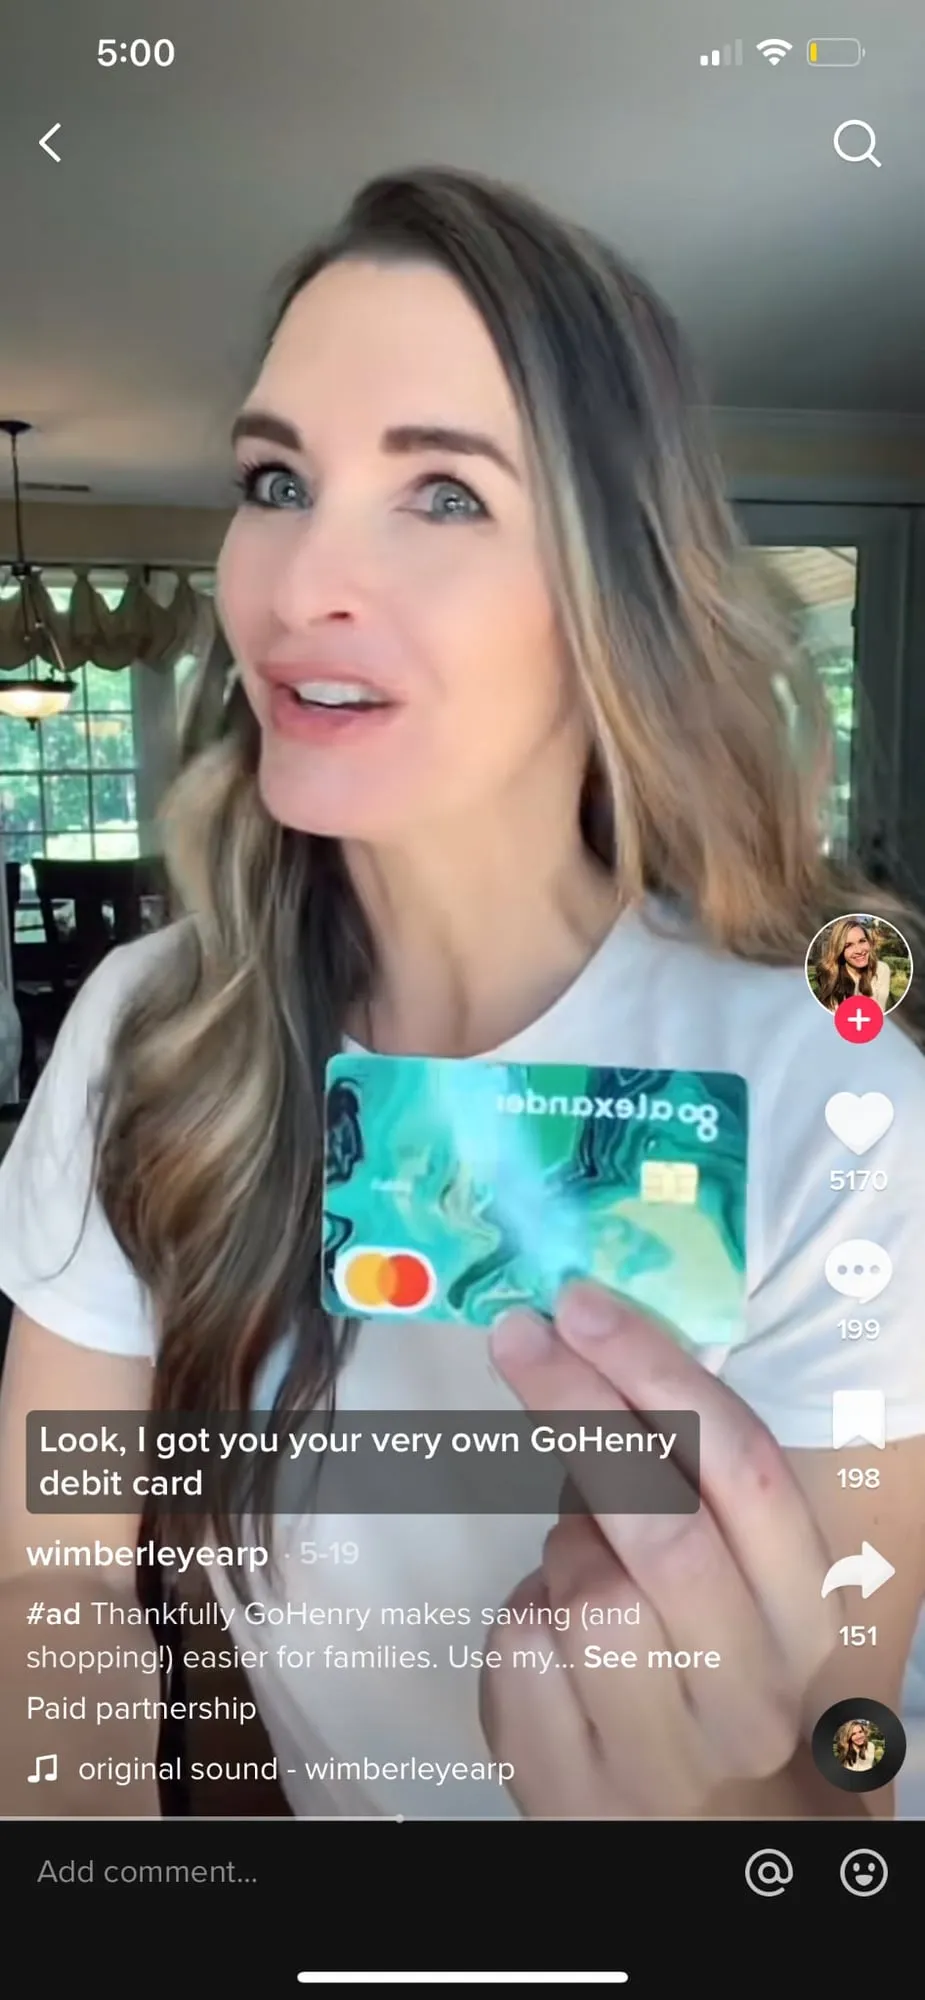
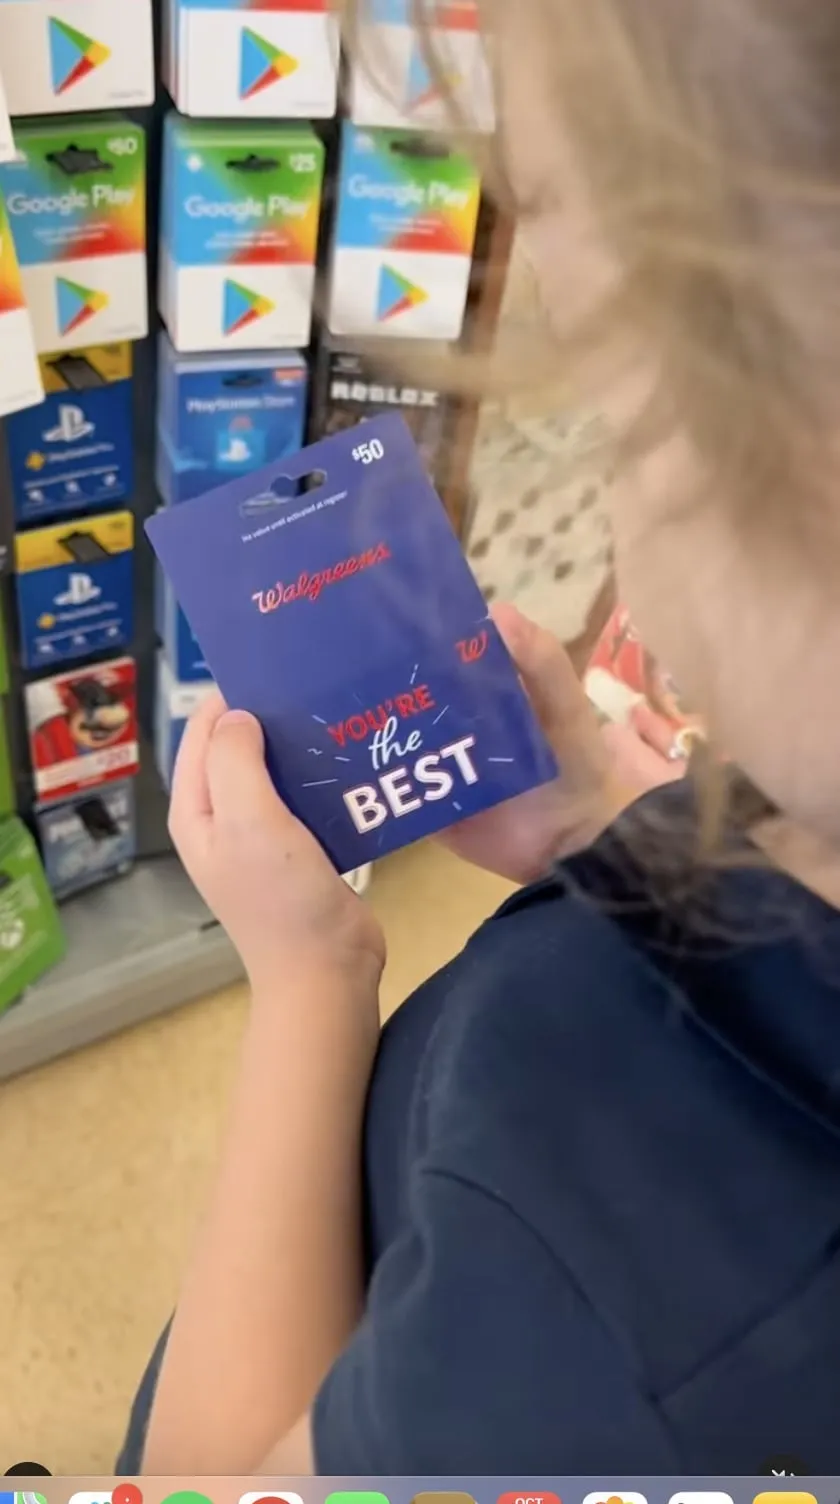
The GoHenry example puts the card into the frame, making the product reference concrete. The Walgreens example shows a shopping environment and gift-card display. These are useful discussion points for a creative review: product visibility, relevant context and a recognizable next step. They illustrate execution choices without implying that the photographed moment records a purchase caused by the campaign.
Campaign in practice: making the product tangible
Keep the promise in the post consistent with the destination. If the creator discusses a particular product or feature, the landing experience should make it easy to locate. If the campaign includes an offer, the terms should be understandable. Agree on the information the creator must include, then let them explain it in language their audience recognizes. Legal accuracy and a human voice can share a brief.
On the reporting side, keep stated intent, traffic and purchases in separate measures. Where the business needs an answer about additional sales, consider an appropriate comparison or holdout design with your measurement team. Tracked purchases can be useful operational evidence, but attribution alone does not prove that every purchase would disappear without the campaign. Choose the method around the decision you need to make.
The 59% willingness figure and the 33% sponsored-post finding give marketers a reason to investigate creator-led consideration. The next planning question is timing: what should someone learn at the first encounter, and what might help them decide later? That brings frequency into the brief alongside the creator, product and offer.
52% say they need at least two product exposures before buying
A single post can introduce a product. How many encounters people believe they need before buying is a different question, and the survey gives marketers a useful starting point. 52% of consumers said they need at least two exposures. Within the responses, 31% selected two to three exposures, while 14% selected four to six. 12% selected one exposure. These are people's estimates of their own buying process, so treat them as a reason to plan and test repeated contact rather than a guaranteed frequency formula.
The distinction matters when you are defending the campaign budget. The research does not establish that buying three posts will deliver three impressions to the same person, or that the third impression will produce a purchase. It does show that a meaningful share of respondents describe a decision that takes more than a first introduction. Your plan needs to consider how an interested viewer will encounter the product again and what the next encounter will add.
Show data
Selected exposure thresholds | |
|---|---|
1 exposure | 12 |
2–3 exposures | 31 |
4–6 exposures | 14 |
- 52%at least two exposures. Combined share, not an additional category.
60% OF CREATORS SAY TWO TO THREE POSTS ARE NEEDED FOR MEANINGFUL ACTION
The creator survey offers a complementary view. 60% said they need two to three posts to generate meaningful audience action. Another 32% selected one post, 7% selected four to six posts, and 1% selected seven or more. These are creators' reported estimates, not a record of purchases attributed to a precise number of posts.
Keep the two questions separate. Consumers were describing exposures before buying; creators were describing posts needed for meaningful audience action. An exposure and a post are different units, and an action could be broader than a sale. The findings point in a similar planning direction without measuring the same event. You can use both to explain why a campaign may need room to develop, while still asking your own reporting to show what happened.
Show data
Posts creators say generate meaningful audience action | |
|---|---|
1 post | 32 |
2–3 posts | 60 |
4–6 posts | 7 |
7+ posts | 1 |
The one-post answer also deserves space in the presentation. Nearly a third of creators chose it. Some recommendations can be timely, clear and immediately relevant; the survey does not justify declaring every single-post activation ineffective. Your product, price, audience and objective should influence the structure. A familiar low-commitment item and a considered purchase may call for different sequences. Use the research to challenge an automatic one-post default, then decide what your specific campaign needs to answer.
A useful sequence gives each appearance a job. The first could introduce the product through a recognizable problem. The next could show a feature in use or respond to a question viewers raised. A later piece could help someone compare options or complete the next step. Those are planning suggestions, not tested stages from this survey. They give your team and creator a concrete way to make repeated content useful rather than replaying the same approved talking points.
That approach also gives approvals a better focus. Review the accuracy of the message and the purpose of each piece before debating every line of delivery. A creator should be able to explain why the audience would want to see the next post. “Because we bought three” is a scheduling answer, and audiences are rarely interested in your statement of work.
For measurement, distinguish planned posts, published posts, delivered impressions and tracked actions. Where you can observe frequency, examine it alongside changes in response. Where you cannot, acknowledge that repeated publishing does not confirm repeated exposure. Agree on a review window that fits the purchase decision, keep a record of the creative sequence and compare results with the objective you approved. The practical opportunity for 2026 is to build a testable path from introduction to consideration, with enough flexibility to learn where interest grows or fades.
Authenticity, product demonstrations and problem-solving lead stated creative preferences
When consumers were asked which ad styles were most likely to influence a purchase, 31% selected authentic and relatable content, 30% selected content showing how a product works, and 29% selected content solving a specific problem. The question allowed more than one answer, so these percentages describe overlapping preferences. They should not be added to claim that 90% of consumers want one of the three, and they are not conversion rates.
For the person writing the brief, the closeness of those results is useful. It points toward content that combines a believable person, an understandable product and a relevant reason to care. You do not have to choose between sounding natural and explaining the product. The challenge is to give the creator enough information to do both without turning the recommendation into a reading exercise.
Show data
Ad styles consumers say are most likely to influence a purchase | |
|---|---|
Authentic and relatable | 31 |
Shows how it works | 30 |
Solves a specific problem | 29 |
GIVE THE AUDIENCE SOMETHING USEFUL TO SEE
Start the brief with the buying question the content should answer. What does the product do? What changes when someone uses it? Which frustration or occasion makes that useful? Then decide what viewers need to see to understand the answer. A product claim can appear in a caption, but a demonstration gives the creator something concrete to show and the audience something specific to evaluate.
NeoReach's campaign work offers practical illustrations. For CLIO's Kill Lash mascara, the creative strategy included get-ready-with-me videos and waterproof tests, showing application and the resulting look while covering important product information. Dupray's NEAT steam cleaner campaign asked cleaning creators to show setup, attachments and use across household surfaces. Use these examples to shape what the creator demonstrates and what the audience should understand. Campaign measurement can then answer the separate question of business impact.
Campaign in practice: showing the product
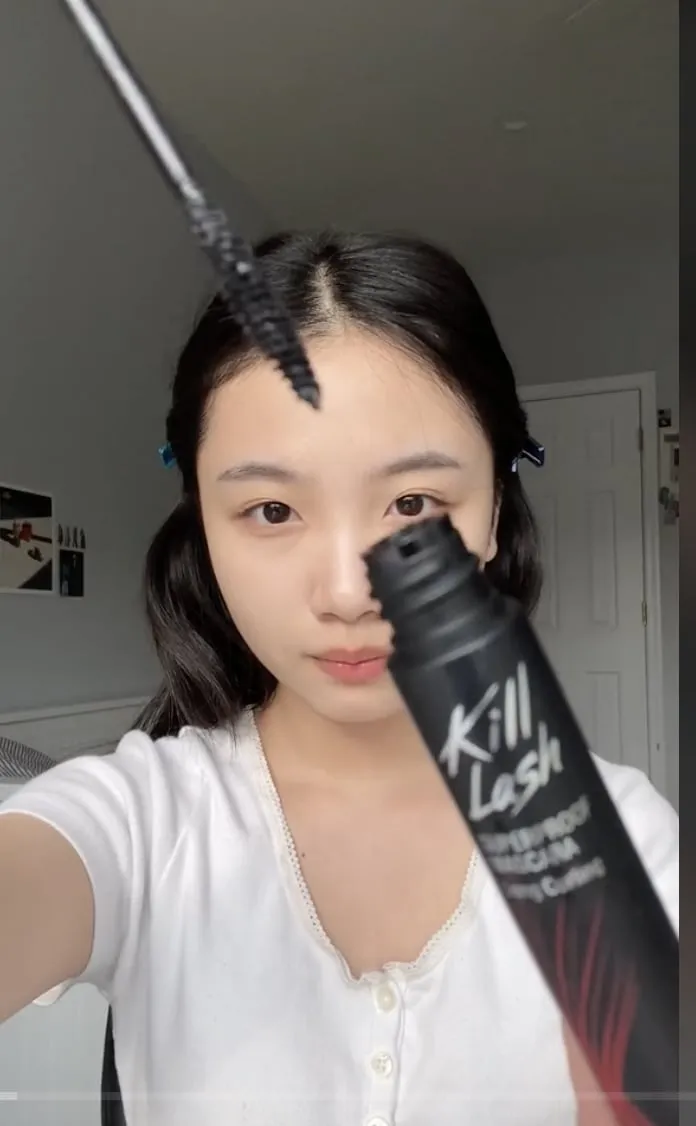
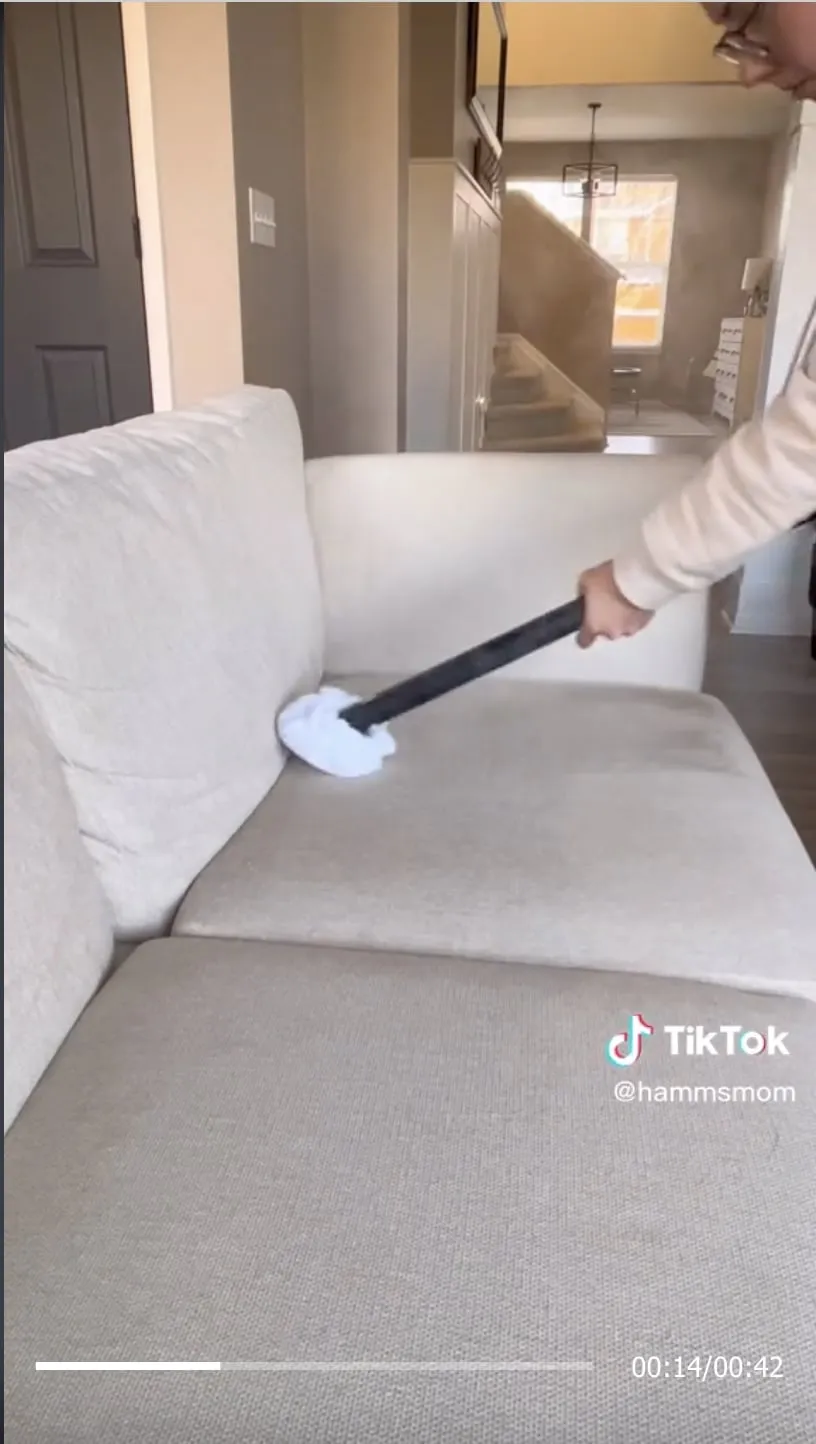
Give the creator a clear account of the product, the claims they can accurately make and the audience question the piece should address. Then invite their input on the opening, setting and sequence. A creator who regularly answers that audience's questions may see a point of confusion your product team has stopped noticing. Involve them before the concept becomes an attachment everyone is too invested in to change.
FAMILIAR SETTINGS CAN MAKE A PROPOSITION EASIER TO UNDERSTAND
Authenticity needs a practical definition in the approval meeting. It can mean the product appears in a context that makes sense for that creator, the explanation sounds like their usual voice, and the experience is represented honestly. It does not require deliberately poor sound, unclear footage or a performance of spontaneity. The survey did not compare production budgets, so it cannot tell you how much polish is too much.
A book discussed in a creator's reading space or a planner used at a desk illustrates this principle. The Amazon Publishing and Happy Planner examples below place the product in recognizable contexts. Bring these references into the creative review and ask which setting would make your own product’s purpose immediately understandable.
Campaign in practice: a recognizable setting
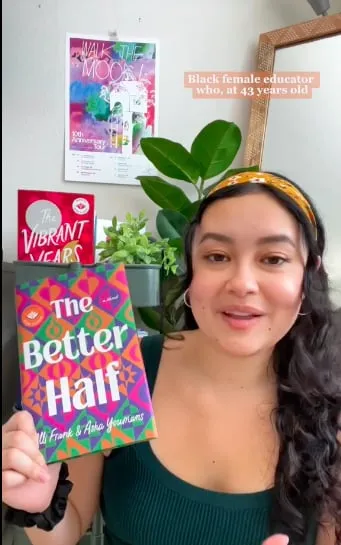
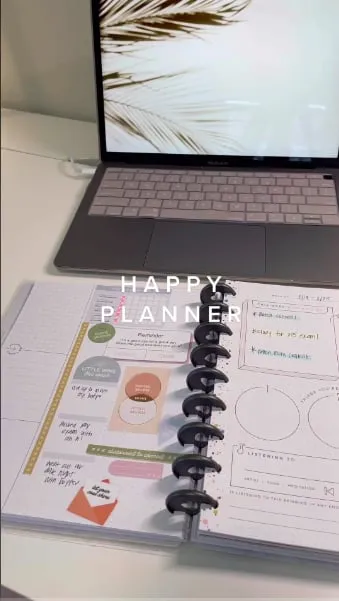
The survey's top three preferences offer a sensible starting point for testing. Ask creators to develop different ways of explaining the same proposition, then judge the results against the objective. Keep enough consistency in the offer and distribution to make the comparison informative. Record what changed between versions; otherwise the eventual “winning insight” can become a story written after the numbers arrive.
Keep the approval process proportionate to the work. Separate corrections to product facts from personal preferences about delivery, consolidate feedback and make the final decision-maker clear. The goal is useful, credible content that your brand can stand behind and the creator can deliver convincingly. That is a more actionable interpretation of the 31%, 30% and 29% findings than adding “be authentic” to the last page of an already overfilled brief.
45% say discounts or promotions make them more likely to buy
An appealing creative idea still has to meet a buying decision. 45% of consumers selected discounts or promotions when asked what would make them more likely to buy from a brand, the leading response in that question. People could choose multiple answers. The result shows the appeal of an incentive; it does not measure how much a discount increased sales or identify the most profitable offer.
For marketers, that leaves useful work to do. Match the incentive to the product, audience and economics of the campaign. A discount can make a decision easier, but you still need to understand margin, eligibility, availability and the cost of acquiring the customer. The survey gives you a reason to test an offer, not a ready-made percentage to take off the price.
- 45%Chart 10 / Consumer survey: selected discounts or promotions — the leading selected incentive in the consumer question. A reason to test an offer. The survey does not establish the most profitable discount or an expected sales increase. Consumer survey • January 2026 • study sample: 1,050 U.S. adults.
MAKE THE OFFER EASY TO UNDERSTAND AND USE
Decide what the audience should do after watching and check that the route works. The landing page should reflect the product and offer described by the creator. The code, eligibility conditions and dates should be easy to find. Test the journey on a phone, including the transition from the platform to the destination. A compelling recommendation has a harder job when the customer has to investigate where the offer went.
Give the creator the details early enough to explain them naturally. If an offer has a genuine deadline, make the timing accurate and ensure it fits the publishing schedule. Keep the product's value visible alongside the incentive so the audience can assess what they are buying. Then measure the actions you can observe: visits, code use and completed purchases, with a consistent reporting window. Someone saying a promotion makes them more likely to buy remains different from a completed transaction.
32% PREFER A CLEAR PAID AD, COMPARED WITH 16% WHO PREFER AN INTEGRATION
The preference question also challenges an assumption that can complicate creative reviews. 32% of consumers preferred a clear, direct paid-media post or ad, while 16% preferred a sponsored post woven into creator content. 37% had no preference, and 15% did not know. Twice as many selected the direct paid option as selected the integration, but the largest individual group had no preference.
These are stated format preferences. They do not show that direct ads convert twice as well or that an integrated sponsorship is necessarily unclear about its commercial relationship. Keep that distinction when the numbers enter the pitch deck. The survey provides a useful reason to test both approaches, with clear presentation of the partnership in either case.
Show data
Ad format preference | |
|---|---|
No preference | 37 |
Clear, direct paid ad | 32 |
Sponsored integration | 16 |
Do not know | 15 |
A direct ad can make the product, offer and next step immediately apparent. An integration can show the product within a wider story or routine. Decide what each format should accomplish, then give it a fair creative treatment. Comparing a carefully developed integration with a hurried ad tells you something about those executions, but it does not settle the format question for every campaign.
Plan permissions and production with the distribution in mind. If you want to run a creator's material in paid media, agree on the usage, adaptations and duration before the team begins making alternate versions. Give the creator enough context to prepare suitable material and keep the connection between each asset and its results. The public post and the advertisement may reach different people under different conditions.
For the budget review, separate the offer, the creative format and the media investment. Each can influence the result, so a combined campaign number alone cannot tell you which change helped. Use the 45% finding to frame an offer test and the 32% versus 16% preference to frame a format test. Decide what success means before launch, then bring back measured outcomes alongside the audience preferences that informed the plan. Your CMO can work with a clear test; an opinion dressed as a conversion forecast is harder to defend.
77% of creators factor time and effort into their rates
Creator relationships are part of the production and performance plan, and pricing is a useful place to make that concrete. 77% of creators cited time and effort in determining their rates, alongside 52% who cited follower count, 48% engagement rate, 31% past brand benchmarks and 29% market demand. These factors are not exclusive shares of one price calculation. A creator can consider several, and the survey does not tell you how much of a quoted fee belongs to each.
For procurement and marketing teams, the practical implication is to make the scope visible. Product testing, concept development, filming, editing, revisions and agreed usage can all affect the conversation. Describe what you need before comparing quotes. A follower count helps describe potential audience scale, but it does not describe the entire production assignment or the permissions you want to purchase.
Show data
Factors creators cite when setting prices | |
|---|---|
Time and effort | 77 |
Follower count | 52 |
Engagement rate | 48 |
Past brand benchmarks | 31 |
Market demand | 29 |
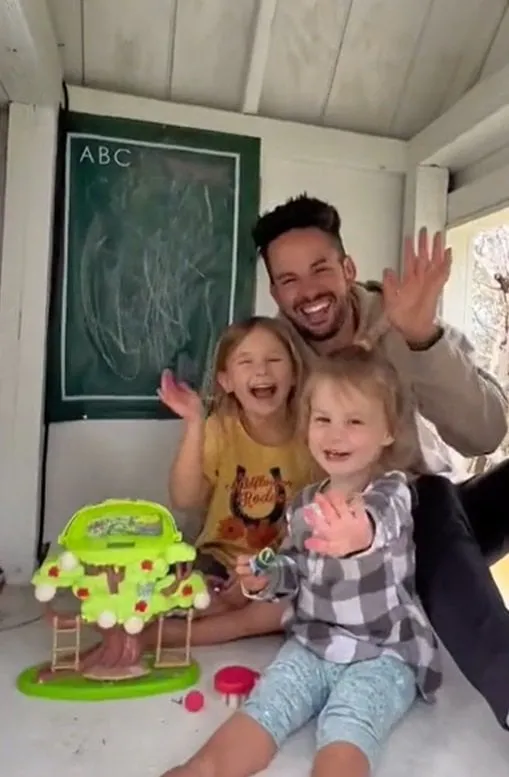
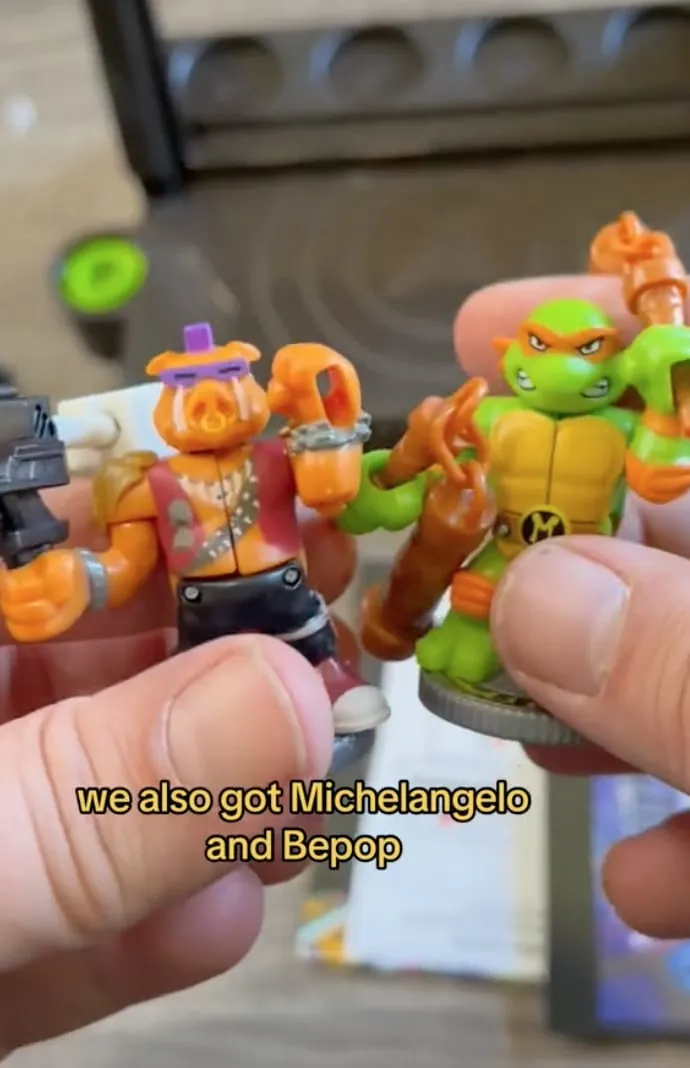
Build creator fit into that conversation. Ask whether the product has a believable place in the creator's content and whether their audience is likely to recognize the use case. Family play around a Bluey product and hands-on Akedo toy content illustrate different ways a product can become part of a creator's setting. Use the examples to discuss suitability and execution, not to claim that one creator profile guarantees a purchase. Fit still needs to be judged for the specific brand, product and audience.
Campaign in practice: play and product detail
THE REPORT HIGHLIGHTS DEMAND FOR CREATIVE FREEDOM AND CLEARER BRIEFS
Two report-level callouts say 74% wanted creative freedom and 73% wanted clearer briefs. The exact question and response base are not provided for those callouts, so treat them as directional signals of requested support. They should not be presented as directly comparable measures or as reasons for renewing a partnership.
The practical planning point is to provide enough direction to understand the job and enough room to make the work credible to an audience. A clear brief should explain the product, essential information and intended audience action. Creative freedom should be discussed in terms everyone can use: which choices are open to the creator, which claims need checking and what must be approved before publication. Leaving those boundaries vague simply moves the negotiation into the revision round.
- 74%Chart 13 / Creator survey — report callout: want creative freedom. Exact question and base unavailable.
- 73%Report callout: want clearer briefs. Exact question and base unavailable. Creator report • overall study sample: 539 • these are support requests, not renewal rates.
91% CITE SMOOTH COMMUNICATION WHEN DECIDING WHETHER TO PARTNER AGAIN
91% of creators cited smooth communication as a factor in partnering again. Treat that preference as an operating priority: make the objective, deliverables, dates and decision-maker clear. Schedule approvals with one person responsible for consolidated feedback. Confirm the offer, destination and permissions needed for paid use before production.
- 91%Chart 14 / Creator survey: selected smooth communication as a reason to work together again. Reported partnership preference. Not a measured renewal rate. Creator survey • January–March 2026 • study sample: 539 creators.
Turn these findings into explicit decisions for the 2026 plan. Give the brief a clear product question and define the audience action you want. Agree on the creative choices the creator owns, and make the review process realistic for everyone doing the work. These are practical recommendations drawn from the survey themes, rather than tested promises of higher returns. An approval schedule deserves the same attention as a posting schedule; one tends to determine whether the other survives.
Build continuity where the relationship and results justify it. The report describes creators valuing responsive communication, fair and timely payment, respect for their creative process and products that make sense for their audience. Those considerations can inform renewal discussions alongside performance. The survey does not establish a universal lift from a longer contract, and a longer commitment should still have clear review points. Give a promising relationship room to develop while keeping the business objective visible.
Finally, agree on what you will learn together. Share the available performance results, distinguish audience reactions from tracked purchases and discuss which parts of the next execution should change. Keep the weaker results in that conversation. An efficient review ends with a specific decision about the next brief, offer, format or distribution plan. The 2026 opportunity is to connect what audiences say they value with working conditions that help creators deliver it, then let measured campaign results guide the next investment.
About the research
This article draws on the Creator Impact Report 2026. Its consumer research surveyed 1,050 U.S. adults through Statista in January 2026. The reported generation samples were 315 Gen Z respondents, 350 millennials, 315 Gen X respondents and 70 boomers. The separate NeoReach creator survey included 539 respondents and ran from January 21 to March 2, 2026. These are total study samples; the report does not disclose every question's response base, weighting or missing responses.
Consumer findings describe recalled behavior, preferences or stated intentions, depending on the question. Creator findings describe respondents' experiences and preferences. Neither survey is a campaign conversion study. Percentages should be interpreted within the relevant question and audience; answers to questions allowing multiple selections can overlap. Rounded figures should not be used to reconstruct exact respondent counts.
The charts reproduce explicit figures in the supplied report. Selected-answer charts are labeled, and ambiguous figures have been omitted. Strategy recommendations are editorial interpretations to test, not measured effects established by the research. The campaign stills come from NeoReach's separate case-study library and illustrate creative execution. They are not survey participants, experimental treatments or evidence of purchases caused by those campaigns.
Use these findings to sharpen decisions about the next brief, audience, offer or partnership. Evaluate performance with the campaign data and research design appropriate to your business question. A useful industry statistic starts a better conversation; a well-designed campaign test helps your team decide what to do next.