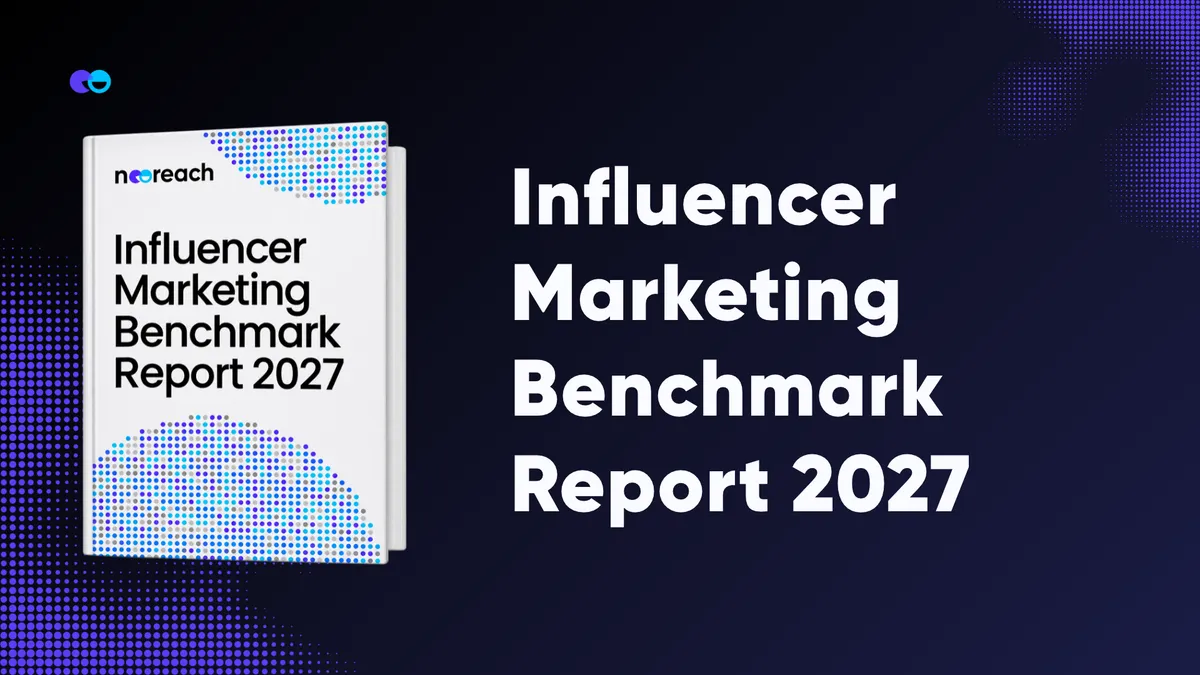

The 2027 NeoReach Influencer Marketing Benchmark Report combines new 2026 creator research with consumer insights to identify practical priorities for influencer marketing strategy and operations.
Our 2027 research captures a creator economy where brand partnerships underpin many businesses and inconsistent income remains creators’ most frequently reported career challenge. As AI-native processes take on routine execution, we believe the teams that redesign work around creative judgment, audience understanding, and strategy will set the pace for 2027.
This report brings together NeoReach creator research and U.S. consumer research to examine how creators earn, how audiences respond, and what makes a partnership workable. The evidence supports a practical planning approach: define the intended action, select the relevant audience and content, and agree the work and measurement needed to assess the outcome.

About 7 in 10 creators named brand deals as their main revenue source
70.3% of 434 creators surveyed; seven of ten figures approximate the share choosing brand deals or sponsored posts
7 of 10creators
NeoReach Creator Earnings Survey, May–Nov 2026. One current main revenue source per respondent.
Show data
Creators | |
|---|---|
Brand deals or sponsored posts | 7 |
Key Findings
50.2% of creators report annual income of $10,000 or less from creator work.
A demanding brief can require substantial production work from a lower-income creator. Scope, production requirements, and compensation need to be assessed together.
70.3% of creators identify brand deals as their main revenue source.
Payment timing, usage rights, and exclusivity affect a creator’s leading revenue source and belong in the initial partnership discussion.
44.8% of U.S. consumers report buying at least one item per month based on creator suggestions.
Another 48.7% report zero monthly purchases. Audience receptivity is an explicit input when setting purchase expectations.
56.1% of creators identify day-in-the-life content among their strongest-performing approaches.
Briefs can test products in recognizable everyday situations, with performance assessed against a defined campaign metric.
76.6% of creators use time and effort to determine their rates.
A comparable quotation needs a defined production scope, including assets, filming requirements, revisions, and publication obligations.
91.2% of creators cite smooth communication as a reason to work with a brand again.
Clear contacts, consolidated feedback, and agreed approval dates address a prominent creator priority for repeat work.
41.7% of creators identify inconsistent income as their hardest career challenge.
Creators need to assess the reliability of contracted work and its payment schedule alongside the stated fee.
41.9% of Gen Z report creator-influenced product purchases, compared with 17.1% of Gen X.
The 24.8 percentage-point difference makes age composition relevant to audience planning. The comparison describes the surveyed groups.
Research Base and Method
NeoReach’s research combines 959 analyzed creator survey responses across two dedicated 2026 studies: 472 on creator earnings and 487 on creator impact. A separate Consumer Insights study of 1,050 U.S. internet users aged 18–64 examines creator-led discovery, purchase behavior, and advertising preferences. Additional Consumer Insights research provides broader platform and media context, with question bases reaching 60,261 respondents.
The framework connects creator economics, creators’ assessments of content and partnerships, and consumers’ reported actions. Creator responses are deduplicated by email within each study. Participation overlaps across the creator studies, which retain separate bases; 959 is the retained response count across both.
Executive Summary
In the earnings survey, 50.2% report annual creator income of $10,000 or less. Brand deals are the main revenue source for 70.3% of detailed-question respondents. Brands planning 2027 activity should make production requirements, usage rights, payment timing, and the fee visible at the start of the relationship.
In the January consumer study, 44.8% report buying at least one item per month based on creator suggestions, while 48.7% report zero. Stated purchase likelihood after a sponsored post is 32.5%. These measures describe different questions; each helps identify what a campaign needs to test before a purchase or revenue assumption is used.
Consumers most often select relatable ads, product demonstrations, and ads addressing a relevant problem. Creators favor everyday context and storytelling in their own performance assessments. A useful 2027 brief connects the creator’s presentation with the information the audience needs to evaluate the product.
Pay and brand alignment receive high importance ratings from 87.7% and 84.8% of creators. Smooth communication and fast payment are selected by 91.2% and 81.5% as reasons to work together again. These findings give brands specific subjects to address in outreach, production, and renewal processes.
Product purchase influence is higher among Gen Z than Gen X within the consumer module’s 18–64 coverage. The creator earnings sample is concentrated in Instagram, TikTok, and lifestyle content. A plan focused on other populations or platforms needs evidence that matches its intended market.
The resulting 2027 agenda is to define commercially workable assignments, build clear paths to action, test formats against product needs, and track the outcomes each partnership is expected to produce.
Report Contents
Section | Topics |
|---|---|
1. Creator Earnings Benchmark | Annual income; monetization mix; platform earnings; sponsorship activity; audience size; management |
2. Creator Impact | Audience actions; purchase frequency; sponsored-post response; repeat exposure; purchase timing; product categories; discovery |
3. Platforms and Content | Platform usage; social activity; media formats; creative approaches; trust; advertising preferences |
4. Brand Partnerships | Collaboration models; deal acceptance; deal rejection; pricing; brand support; repeat work; brand misunderstandings |
5. Creator Careers | Creator profile; working patterns; education; business ownership; success measures; career pressures |
6. Audience and Brand Values | Audience differences; brand purchase drivers; brand positions; issue priorities |
Research guide: E = NeoReach Creator Earnings Survey; I = NeoReach Creator Impact Survey; S1–S4 = Statista Consumer Insights data exported for NeoReach. S1 is used in NeoReach’s Creator Impact Report 2026. Creator figures use the latest submission per normalized email within each survey. The two creator samples are analyzed separately. Question bases and fieldwork are shown with the exhibits and in Research Notes; groups below thirty respondents are exploratory.
Letter from the Editors
2026: The Year the Creator Economy Had to Confront Its Own Success
For years, we've measured the creator economy through an almost uninterrupted narrative of growth. Bigger budgets, rising valuations, expanding audiences, and increasingly sophisticated ways to monetize human attention. Every new industry report seems to reinforce the same conclusion: the creator economy is becoming one of the most important forces in modern marketing.
Yet beneath the industry's impressive numbers, something more fundamental is happening.
Our research brings creators’ own priorities into this discussion. In NeoReach’s earnings survey, 34.3% identify connecting with their audience as their principal motivation. In our separate creator impact study, 41.7% identify inconsistent income as the hardest part of their career. Together, these findings make the relationship with an audience and the viability of the work central questions for the industry’s future.
Creators also have a clear perspective on how that relationship is maintained. In our impact study, 59.8% identify unfiltered short-form content among the formats that build the most audience trust, and 84.8% give brand alignment a high importance rating when considering a deal. These findings give brands specific responsibilities to consider: the relevance of the product, the experience supporting a recommendation, and the commercial terms under which creators produce it.
Governments are restricting young people's access to social platforms, challenging how an entire generation of consumers can be reached. Meanwhile, AI-generated personalities are blurring the boundaries between human experience and manufactured authenticity.
We've spent years perfecting systems that capture attention, influence behavior, and monetize human relationships. Now we're being forced to examine the consequences of that success.
The timing is striking. Just as the creator economy reaches commercial maturity, the very foundations of its growth, attention, accessibility, and authenticity, are being questioned.
Perhaps we're not witnessing a crisis of growth, but something more profound: an industry being forced to confront the difference between commercial success and genuine human value.
For 2027, we believe the industry’s progress should be assessed through the usefulness of its recommendations, the economic viability of creator work, and the outcomes audiences experience. Those measures give brands, platforms, and creators a concrete basis for examining who benefits from the value this industry generates.
Creator Earnings Benchmark
Half of earnings-survey respondents report annual creator income of $10,000 or less, and sponsorship is the leading revenue source among those answering the detailed questions. At the same time, audience scale, working patterns, and representation coincide with substantial differences in income.
Income, revenue source, and sponsored-content volume answer separate commercial questions. Read together, they help establish the creator’s revenue context, the scale of paid work, and the production commitment a proposed assignment would require.
Annual Income
- 50.2%of earnings-sample creators report annual creator income of $10,000 or less
- 20.1%earn above $50,000
In the NeoReach earnings sample, 50.2% of creators report annual creator income of $10,000 or less, while 20.1% earn above $50,000. The distribution spans occasional income and substantial creator businesses, making the income band a useful starting point for assessing a creator’s operating scale.
Partnership budgets should distinguish the work required from the creator’s current earnings. A lower-income creator may still face substantial production costs for a demanding brief. Brands can make proposals easier to assess by specifying deliverables, production requirements, usage rights, payment timing, and the work covered by the fee. Creators can use the distribution to set income goals against the economics of their own workload.
Show data
Share of creators | |
|---|---|
$0-$5,000 | 32.8 |
$5,001-$10,000 | 17.4 |
$10,001-$15,000 | 6.6 |
$15,001-$25,000 | 7.2 |
$25,001-$35,000 | 8.3 |
$35,001-$50,000 | 7.6 |
$50,001-$75,000 | 4.9 |
$75,001-$100,000 | 5.5 |
$100,001-$125,000 | 2.8 |
$125,001-$150,000 | 1.9 |
$150,001-$175,000 | 1.7 |
$175,001-$200,000 | 1.1 |
$200,001-$300,000 | 1.1 |
$300,001-$400,000 | 0.4 |
$400,001-$500,000 | 0.4 |
$600,001-$700,000 | 0.2 |
$1M+ | 0.2 |
Monetization Mix
Brand deals are the main revenue source for 70.3% of the 434 creators answering the detailed revenue questions, and the preferred main source for 66.1%. An owned brand or company is the current main source for 6.9% and the preferred source for 12.7%. The 5.8 percentage-point difference identifies an aspiration for business ownership within a sample that remains strongly oriented toward sponsorship.
This combination gives brands a practical basis for 2027 relationship planning. A partnership can support a creator’s immediate income requirements while recognizing their wider commercial interests. Agreements should make exclusivity, competing products, and ownership of content explicit. For creators considering an owned business, the relevant planning question is how product development, customer service, and financing would fit alongside sponsored-content commitments.
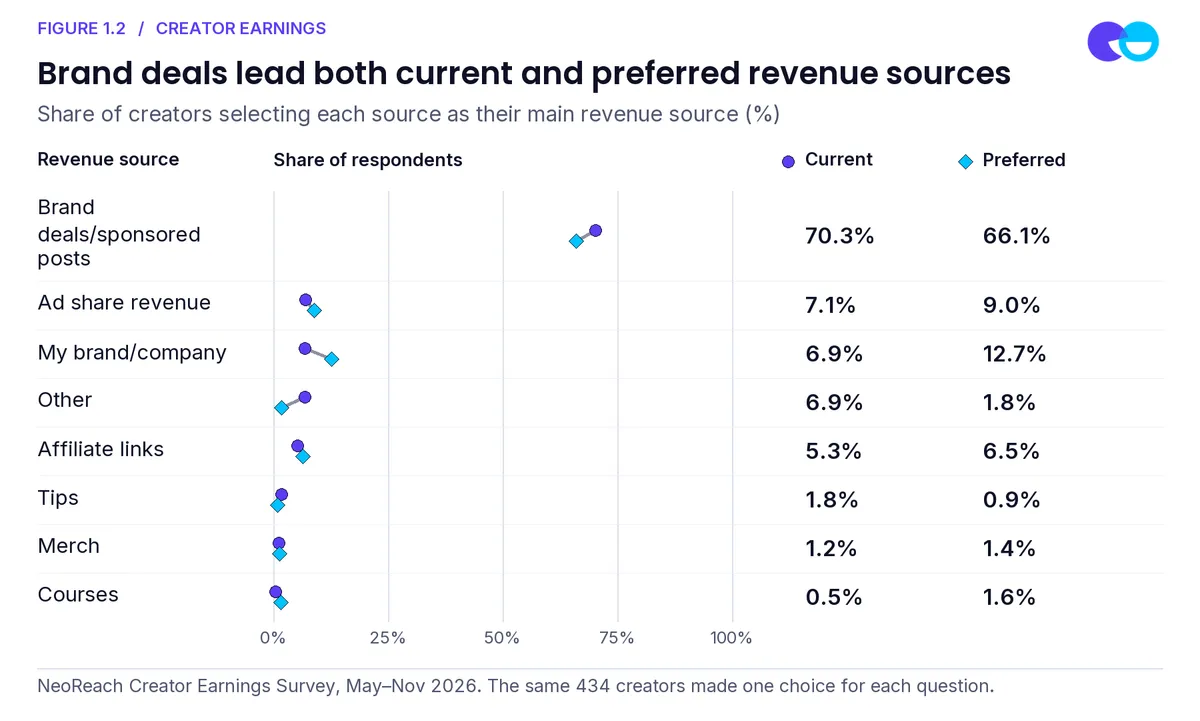
Figure 1.2. Brand deals lead revenue choices while owned businesses attract interest.
Each response identifies one main revenue source. The current and preferred distributions describe revenue priorities across the same question base.
Platform Earnings
Instagram brand deals generate positive income for 87.3% of detailed-earnings respondents, followed by TikTok deals at 65.7%. Meta native payouts reach 61.5%, TikTok native payouts 53.5%, and affiliate programs 51.8%. Among Instagram-deal earners, the median annual income band from that source is $2,501–$5,000; for TikTok-deal earners it is $1,001–$2,500.
Channel planning should separate access to income from the amount it produces. Figure 1.3 compares the share earning income from each source. Supporting Research gives the median income band among earners for each source. Brands should assess platform fit through the creator’s relevant audience, proposed deliverables, and campaign objective. The sample’s concentration in Instagram and TikTok is a material part of the platform comparison.
Show data
Share earning above zero | |
|---|---|
Instagram deals | 87.3 |
Meta native payouts | 61.5 |
TikTok deals | 65.7 |
TikTok native payouts | 53.5 |
YouTube deals | 22.1 |
YouTube native payouts | 24.9 |
Twitch deals | 4.6 |
Twitch native payouts | 6 |
Snapchat deals | 4.4 |
Snapchat native payouts | 3.9 |
Fan monetization platforms | 11.1 |
Affiliate programs | 51.8 |
Figure 1.3. Instagram sponsorship has the broadest earnings participation in the sample.
Sponsorship Activity
A combined 74.6% report one to twenty sponsored posts over twelve months, including 51.7% in the one-to-ten range. Another 8.1% report zero sponsored posts, and 6.1% select fifty or more. A single activity benchmark would combine creators with very different levels of brand work.
For a 2027 brief, the practical question is how the proposed assignment fits the creator’s capacity and commercial calendar. A multi-post agreement may represent a meaningful share of a lower-volume creator’s annual sponsored work. Brands should confirm production capacity, existing commitments, exclusivity, and the time available for revisions before setting delivery dates. Creators can assess the opportunity against their total paid workload and expected income.
Show data
Share of creators | |
|---|---|
0 | 8.1 |
1–10 | 51.7 |
11–20 | 22.9 |
21–30 | 7.6 |
31–40 | 2.3 |
41–50 | 1.3 |
50+ | 6.1 |
Figure 1.4. Most respondents report one to twenty sponsored posts over twelve months.
The measure counts sponsored posts over twelve months. Partnership counts in the supporting research describe brand relationships and have a separate unit and period.
Income by Audience Size
Annual income differs substantially across combined-follower bands. The share earning above $50,000 is 4.7% among creators with 10,000–50,000 followers and 43.2% among those with 500,000–1 million. Even in the latter group, 56.8% report income of $50,000 or less. Audience scale is associated with earnings, while creators within each band retain a wide range of economic outcomes.
Follower count can help define a comparison group when it is considered alongside content costs, audience relevance, and commercial activity. Creators evaluating audience-growth investments should specify how additional reach could produce revenue through sponsorship, native payouts, affiliate activity, or owned products. The upper follower tiers require particular caution because their small bases give individual responses considerable influence over the percentages.
Show data
Share earning more than $50,000 | |
|---|---|
Under 10K (n=30) | 3.3 |
10K–50K (n=148) | 4.7 |
50K–100K (n=81) | 16 |
100K–250K (n=88) | 20.5 |
250K–500K (n=54) | 33.3 |
500K–1M (n=37) | 43.2 |
1M–5M (n=27) | 55.6 |
5M–10M (n=4) | 100 |
10M+ (n=3) | 100 |
Figure 1.5. Higher audience bands contain more creators earning above $50,000.
The chart compares within-band income shares. Combined following is self-reported across channels, and groups below thirty respondents are exploratory.
Talent Management
Among represented creators, 51.5% report annual income above $50,000, compared with 14.9% of independent creators. The median income band is $50,001–$75,000 for the 68 represented respondents and $5,001–$10,000 for the 404 independent respondents. These groups may also differ in audience scale, experience, workload, and the likelihood of securing representation.
The 2027 decision for a creator considering management is whether the proposed service improves the economics and operation of their own business. That assessment should specify fees, scope, negotiation support, payment administration, and the work the creator still needs to perform. Brands engaging represented creators can clarify who controls creative decisions, contracting, approvals, and reporting. Evaluating management’s independent contribution would require a comparison that accounts for relevant creator characteristics.
Show data
Share earning more than $50,000 | |
|---|---|
Independent (n=404) | 14.9 |
Managed (n=68) | 51.5 |
Figure 1.6. Managed creators more often report annual income above $50,000.
The earnings difference is descriptive. Audience size, experience, and selection into representation remain possible explanations for the observed association.
Creator Impact
The path from creator exposure to purchase contains several decisions: whether the audience is receptive, which product category matters, how often people encounter the message, and how they find and buy the product. The consumer evidence identifies both responsive groups and substantial shares reporting resistance or uncertainty.
A defined path to action connects the product proposition with discovery, repeated exposure, and the next purchase step. Each element can be tested with its own audience and outcome measure. The consumer and creator findings provide starting hypotheses for that design.
Audience Actions
In the January consumer study, 30.8% report trying a restaurant or food because of a creator, 29.4% report buying a product, and 19.2% report trying a routine. Travel bookings and event attendance also appear. At the same time, 45.1% select none of the listed actions, showing the importance of identifying a receptive audience.
The campaign brief should name the intended action before selecting the creator and format. A restaurant visit, product purchase, app download, and change in routine each require a different offer and measurement approach. The survey provides a set of outcomes to consider; campaign evaluation needs a defined audience, a specific action, and a way to observe that action within an appropriate period.
Show data
Share of consumers | |
|---|---|
Attend an event | 13.6 |
Book a travel experience | 15.4 |
Purchase a product | 29.4 |
Try a new restaurant/food | 30.8 |
Try a new routine (fitness, skincare, productivity, etc.) | 19.2 |
Other | 2.5 |
None of the above | 45.1 |
Figure 2.1. Consumer actions span food, products, routines, travel, and events.
Consumers can select several actions. Each share uses the full base of 1,050 U.S. internet users aged 18–64.
Creator-Reported Actions
Product buying is the most widely reported action in the creator impact sample: 89.7% say they have influenced their audience to buy a product. Trying a service receives 62.6%, downloading an app 58.9%, and changing a habit or routine 47.4%. The breadth of reported actions gives brands several ways to define a creator’s contribution beyond a single product category.
Discovery conversations should ask creators for examples relevant to the proposed outcome and the evidence available to support them. A creator’s experience with app downloads may be useful for an acquisition brief; experience with routines may be useful for a product that needs explanation and repeated use. The consumer and creator surveys provide separate perspectives, with different questions and populations. Each perspective should retain its own denominator in reporting.
Show data
Share of creators | |
|---|---|
Buy a product | 89.7 |
Try a service | 62.6 |
Download an app | 58.9 |
Change a habit or routine | 47.4 |
Attend an event | 42.7 |
Travel to a destination | 37 |
Other | 9 |
Figure 2.2. Creators report influence across several commercial actions.
The unit is a creator who reports influencing an action. Audience-level conversion requires audience exposure and outcome data.
Purchase Frequency
- 44.8%of consumers report buying at least one item per month based on creator suggestions
- 48.7%report zero monthly items
A combined 44.8% of consumers report buying at least one item per month based on creator suggestions. The largest purchasing group selects one to two items, at 25.8% of the full sample. Another 14.1% select three to five, while 4.9% select six or more. A further 48.7% report zero monthly items and 6.6% are uncertain.
Purchase-frequency assumptions should reflect this uneven distribution. A campaign addressing an audience with limited creator-led buying may need a stronger product explanation, a relevant offer, or additional consideration time. Brands can use the survey as context for testing frequency and repeat purchase within their own customer base. Revenue forecasts require product prices, measured conversion, purchase frequency, and audience size from the campaign or business being planned.
Show data
Share of respondents | |
|---|---|
None | 48.7 |
1-2 items | 25.8 |
3-5 items | 14.1 |
6-10 items | 3.7 |
10+ items | 1.1 |
Don't know | 6.6 |
Figure 2.3. 44.8% report at least one monthly purchase on creator suggestions.
Sponsored-Post Response
- 32.5%likely or extremely likely to buy after a sponsored post
- 30.1%unlikely or extremely unlikely
- 30.0%neutral
A combined 32.5% select likely or extremely likely, 30.1% select unlikely or extremely unlikely, and 30.0% are neutral. Another 7.4% are uncertain. The result makes audience receptivity an explicit planning variable, alongside product relevance and the execution of the post.
Brands should use creative tests to establish which audiences respond to a clear proposition and which messages help neutral consumers evaluate the product. A useful test defines the audience, offer, exposure, and outcome before comparing variants. The survey’s stated intent can guide those questions. A purchase forecast requires observed campaign response and an estimate of how exposure relates to completed transactions.
Show data
Share of respondents | |
|---|---|
Extremely likely | 13 |
Likely | 19.5 |
Neutral | 30 |
Unlikely | 11.1 |
Extremely unlikely | 19 |
Don't know | 7.4 |
Figure 2.4. Purchase intent after sponsored content is divided.
Repeat Exposure
Consumers most often specify two to three exposures to a sponsored post or advertisement before purchase, selected by 30.8%. One exposure receives 11.5%, four to six receives 14.3%, and seven or more receives 6.6%. The largest individual answer is uncertainty, at 36.9%, which places a clear boundary around frequency assumptions derived from recall.
A repeated-exposure test should compare audience response at defined levels of delivered frequency and account for message variation. Brands can set a clear stopping or scaling rule based on measured outcomes and cost. The survey supports examining repeated exposure as a planning question. The effective level for a particular campaign depends on the product, audience, message, and the frequency people actually receive.
Show data
Share of respondents | |
|---|---|
1 time | 11.5 |
2-3 times | 30.8 |
4-6 times | 14.3 |
7+ times | 6.6 |
Don't know | 36.9 |
Figure 2.5. Two to three exposures is the most frequently specified purchase response.
Posts Before Action
Among creators, 61.2% report typically needing two to three posts to see meaningful audience action when promoting a brand. One post receives 31.0%; four or more receives 7.8%. The result gives a practical reason to assess the sequence of a campaign’s messages and the role of each contracted post.
A 2027 multi-post brief can assign a clear purpose to each deliverable, such as introducing a product, demonstrating use, or answering questions. Brands and creators should agree on the intended action and the evidence used to assess it. This is particularly important because the survey’s meaningful-action category is broad. The creator assessment and the consumer exposure question describe different units, so their similar response labels support separate tests.
Show data
Share of creators | |
|---|---|
One post | 31 |
Two to three posts | 61.2 |
Four to six posts | 6.8 |
Seven+ posts | 1 |
Figure 2.6. Creators most often identify two to three posts before meaningful action.
Purchase Timing
An immediate purchase receives 7.7%, within a day 13.9%, and within a week 23.0%. Another 13.8% select longer than a week. A further 30.3% say they would refrain from buying on a creator recommendation, while 11.2% are uncertain.
Campaign measurement should specify when an action is expected and how delayed response will be captured. The relevant observation period may differ for a low-cost purchase, a travel decision, or an item requiring research. Brands can compare short-window results with later outcomes where data access allows. The survey provides timing context; choosing a campaign attribution window requires transaction timing, exposure information, and a measurement design suited to the product.
Show data
Share of respondents | |
|---|---|
Immediately | 7.7 |
Within a day | 13.9 |
Within a week | 23 |
Longer than a week | 13.8 |
Don't know | 11.2 |
I would not buy from a creator's recommendation | 30.3 |
Figure 2.7. Reported purchase timing extends beyond the immediate response.
Product Categories
Food and beverage leads stated receptivity to buying on a creator recommendation, selected by 35.0% of consumers. Clothing and accessories receives 26.5%, beauty and skincare 23.8%, and fitness and health products 19.7%. A further 32.1% select none of the listed categories. Category relevance therefore belongs near the start of a creator-marketing brief.
Product teams should identify the specific question that content needs to answer: taste, use, fit, appearance, or another purchase consideration. Creator selection and creative development can then be assessed against that question. The category ranking provides context for setting expectations across a portfolio. Budget allocation requires the brand’s own evidence on audience quality, acquisition costs, margins, and incremental outcomes for each product.
Show data
Share of consumers | |
|---|---|
Apps | 16.5 |
Beauty/skincare | 23.8 |
Clothing/accessories | 26.5 |
Experiences (travel, events, classes) | 17.1 |
Fitness/health products | 19.7 |
Food/beverage | 35 |
Home goods/decor | 14.5 |
Tech/gadgets | 18.4 |
Other | 2.3 |
None of the above | 32.1 |
Figure 2.8. Food and beverage leads category receptivity.
Product Discovery
YouTube video descriptions lead reported discovery surfaces for creator-recommended products at 31.3%, followed by TikTok videos at 28.2%, Instagram Stories at 25.2%, and Instagram feed posts at 24.0%. Amazon Storefront receives 16.8%. Discovery can therefore occur in the content itself or through the links and product information that accompany it.
Every deliverable should specify where a consumer can find the product after viewing. Brands and creators can check links, product naming, availability, landing pages, and the information needed to continue evaluating the offer. The practical measurement question is how discovery connects to the next action. Tracking should preserve the distinction between the surface where the product is found and the channel where the transaction is completed.
Show data
Share of consumers | |
|---|---|
Amazon Storefront | 16.8 |
Instagram feed posts | 24 |
Instagram Stories | 25.2 |
Linktree or bio links | 7 |
LTK (LikeToKnow.it) | 5.3 |
TikTok Stories/Now | 16.7 |
TikTok videos | 28.2 |
YouTube video descriptions | 31.3 |
Other | 4.1 |
None of the above | 31.5 |
Figure 2.9. Discovery spans videos, Stories, and links beside content.
Platforms and Content
Facebook and YouTube have broad consumer usage in the supplied research, while the creator earnings sample is concentrated in Instagram and TikTok. Consumers show strong short-video preference, and creators identify everyday context, storytelling, and direct presentation as useful creative approaches.
Platform reach identifies where an audience may be available. Creative format determines how the product can be explained, and the next step determines how interested consumers can act. Testing those elements together gives the allocation decision a specific commercial basis.
Platform Usage
In the larger consumer dataset, regular use is highest for Facebook at 70.3%, followed by YouTube at 61.6%, Instagram at 52.7%, and TikTok at 45.4%. The earnings survey is more concentrated: Instagram is the primary platform for 64.8% of creators and TikTok for 27.3%. These results describe separate samples and reveal the scope of each evidence source.
Platform selection should start with the intended audience and action. Broad usage provides a reach baseline, while creator discovery needs an assessment of audience composition, content suitability, and commercial evidence on that platform. The earnings results offer the most detail for Instagram- and TikTok-focused creators. A plan centered on other platforms will benefit from additional creator and campaign evidence specific to those channels.
Show data
Share of consumers | |
|---|---|
BeReal. | 3.5 |
Bluesky | 5.3 |
Clubhouse | 3.3 |
70.3 | |
Flickr | 4.6 |
Foursquare | 3.1 |
52.7 | |
18.3 | |
Mastodon | 1.5 |
22.7 | |
16.8 | |
Snapchat | 28.5 |
TikTok | 45.4 |
Tumblr | 4.9 |
Twitch | 9.5 |
2.5 | |
X (Twitter) | 27.2 |
Yelp | 3.1 |
YouTube | 61.6 |
Other | 2 |
I do not use social media regularly | 3.8 |
Figure 3.1. Facebook and YouTube lead regular consumer platform use.
Social Activity
Consumers more often report liking creator posts or following creators than liking company posts or following companies: 35.7% versus 26.5% over the previous four weeks. Sharing shows a similar pattern, at 23.1% for creator content and 15.5% for company content. The differences describe how broadly each activity appears across respondents.
Creator content can be evaluated as one route to audience interaction within the broader media plan. Brands should define what a share, comment, follow, or save contributes to the campaign objective and assess the quality of those interactions where possible. Comparing creative approaches requires comparable exposure data. The survey measures participation in activities, so campaign tests need their own denominators for engagement rates and costs.
Show data
Share of respondents | |
|---|---|
Sent private messages | 50.1 |
Commented on posts | 47.2 |
Posted pictures / videos / texts / status updates | 38.6 |
Liked posts by other users or followed people | 50.1 |
Shared posts by other users | 36 |
Liked company posts or followed companies | 26.5 |
Shared company posts | 15.5 |
Liked posts by influencers / content creators or followed influencers / content creators | 35.7 |
Shared posts by influencers / content creators | 23.1 |
Other | 4 |
I have only used social media passively | 8.4 |
I haven't used social media | 6.3 |
Figure 3.2. More consumers report interacting with creators than with companies.
Media Formats
Short videos and reels receive the highest media-format preference at 61.6%. Text receives 42.6%, long video 40.1%, audio 38.2%, and images or infographics 31.0%. Multiple selections show that consumers can value several formats. A format plan can therefore combine broad appeal with the depth of explanation a product requires.
Short video is a clear candidate for testing discovery and concise demonstrations. Longer video or text can support more detailed product questions where audience behavior and the content environment make them suitable. The supporting research also shows live viewing and replay audiences. Format decisions should account for the intended action, production requirements, and the customer information needed at that point in the journey.
Show data
Share of consumers | |
|---|---|
Audio | 38.2 |
Images/infographics | 31 |
Long videos | 40.1 |
Short videos / reels | 61.6 |
Text | 42.6 |
Other | 5.1 |
Don't know | 9.2 |
Figure 3.3. Short video leads preference while other formats retain audiences.
Content Performance
Creators most often identify authentic day-in-the-life content as producing their strongest results, at 56.1%. Story-driven content receives 44.4%, trend-based content 42.3%, tutorials 37.0%, and product reviews 36.3%. High-production content receives 24.0%. The selections point toward recognizable situations, narrative, and explanation as useful starting points for creative development.
A brief can ask the creator to show where the product fits in a real routine and what the audience needs to understand about it. Brands should agree on the product claims and essential information while giving the creator room to determine the presentation. Because creators define their own strongest results, testing should specify whether success means attention, engagement, site activity, or a transaction.
Show data
Share of creators | |
|---|---|
Authentic day-in-the-life content | 56.1 |
Story-driven content | 44.4 |
Trend-based content | 42.3 |
Tutorials/how-to videos | 37 |
Product reviews | 36.3 |
Before-and-after transformations | 28.3 |
High-production content | 24 |
Other | 9 |
Figure 3.4. Creators favor everyday context and storytelling in reported performance.
Audience Trust
Stories are selected by 61.8% of creators as a format that builds the most audience trust, and unfiltered short-form content by 59.8%. Behind-the-scenes content receives 29.8%, long-form reviews 20.3%, and livestreams 12.1%. The leading responses suggest that creators associate trust with formats that allow a direct and familiar presentation.
Trust-focused content can make the creator’s experience with the product visible and explain the basis for the recommendation. The brief should allow enough time for product access and a credible account of use. Brands can assess audience trust directly through a defined survey or relevant research alongside campaign outcomes. The creator’s format preference helps generate the test; the audience’s response determines whether the approach works for the brand.
Show data
Share of creators | |
|---|---|
Stories | 61.8 |
Unfiltered short-form | 59.8 |
Behind-the-scenes content | 29.8 |
Long-form reviews | 20.3 |
Livestreams | 12.1 |
Other | 9 |
Figure 3.5. Stories and unfiltered short video lead creators’ trust assessments.
Advertising Preferences
Authentic and relatable ads lead stated purchase influence at 31.0%, closely followed by ads showing how a product works at 29.5% and ads addressing a specific problem at 29.2%. Ads featuring a favorite creator receive 10.9%. The result makes the content’s usefulness and the proposition important parts of creator selection and briefing.
Briefs should identify the audience problem, the product’s relevant function, and the evidence the creator can show. Creative tests can compare a demonstration, a personal account, and an offer while keeping the target audience and measurement consistent. This approach gives the brand a clearer basis for deciding which message works. A preferred creator can contribute context and credibility when the content also answers a purchase question.
Show data
Share of consumers | |
|---|---|
Ads that feel authentic and relatable | 31 |
Ads that show how the product works | 29.5 |
Ads that solve a specific problem I have | 29.2 |
Limited-time offers or discounts | 26 |
Funny or entertaining ads | 22.8 |
Ads with personal testimonials or reviews | 21.2 |
Ads with high-quality visuals or production | 20.3 |
Before-and-after transformations | 20.3 |
Ads tied to trends or viral content | 11.5 |
Ads featuring my favorite creators/influencers | 10.9 |
None of the above | 20.7 |
Figure 3.6. Consumers prioritize relatability, demonstration, and a relevant problem.
Sponsored Content vs Ads
When asked which approach is more likely to prompt a purchase, 32.2% of consumers select a clear, direct paid advertisement and 16.2% select sponsorship woven into a creator’s regular content. The largest group, 36.7%, expresses equal preference, and 15.0% is uncertain. These responses leave room for several creative and distribution approaches.
Brands can compare a clear product message with an integrated creator treatment using a defined audience, equivalent objectives, and appropriate outcome measures. Rights and distribution costs should be included when assessing the economics of each option. Preference is one input into that test. The stronger commercial decision will depend on observed response, the cost of producing and distributing the content, and the campaign’s contribution to the intended outcome.
Show data
Share of respondents | |
|---|---|
A sponsored post (brand woven into the creator's regular content) | 16.2 |
A clear, direct paid media post/ad | 32.2 |
No preference | 36.7 |
Don't know | 15 |
Figure 3.7. Direct paid ads receive more purchase preference than integrated sponsorship.
Action by Format
TikTok videos are selected by 62.8% of creators as a source of their strongest conversion or audience action, and Instagram Reels by 60.4%. Instagram Stories receives 45.8%, followed by links in a bio at 21.4% and affiliate links or storefronts at 18.5%. Creators can select several formats, reflecting multiple routes to action within their work.
These responses support testing how a short video connects with the next step, whether that is a Story, product page, tracked link, or storefront. Each step should have a defined role and an observable measure where data access allows. The creator’s assessment can guide format selection, while the brand’s campaign data can establish which combinations produce the desired action at an acceptable cost.
Show data
Share of creators | |
|---|---|
TikTok videos | 62.8 |
Instagram Reels | 60.4 |
Instagram Stories | 45.8 |
Link in bio | 21.4 |
Affiliate links / storefronts | 18.5 |
YouTube Shorts | 18.3 |
YouTube videos | 14 |
Other | 5.1 |
Figure 3.8. TikTok videos and Instagram Reels lead creators’ action assessments.
Brand Partnerships
Creators place high importance on compensation and brand fit, identify production time as a major pricing input, and associate repeat work with communication and payment speed. These subjects can be addressed directly in the proposal, contract, production process, and renewal discussion.
A proposal that defines scope, compensation, creative responsibilities, and payment terms gives both parties a concrete basis for deciding whether to work together. The same agreement can guide production reviews and the decision to renew.
Collaboration Models
Sponsored posts are the most common collaboration model at 81.3%, while 49.5% of creators select user-generated content or content-for-hire, 40.0% select affiliate work, and 32.6% select long-term ambassadorships. Paid amplification appears in 26.5%. The same creator can participate in several models, with different work, rights, and commercial responsibilities.
A proposal should specify what the brand is purchasing: content production, access to the creator’s audience, paid distribution rights, an ongoing relationship, or a combination. That definition determines deliverables, approval requirements, compensation, and measurement. Content-for-hire can be assessed against its production scope and use; a sponsored post also requires an audience and distribution assessment. Affiliate work needs clear tracking, commission terms, and payment administration.
Show data
Share of creators | |
|---|---|
Sponsored posts | 81.3 |
UGC/content-for-hire | 49.5 |
Affiliate/commission-based content | 40 |
Long-term brand ambassadorships | 32.6 |
Whitelisting/paid amplification | 26.5 |
Product seeding only | 9.9 |
Other | 7.6 |
Figure 4.1. Creators work across sponsored posts, content production, and affiliate models.
Deal Acceptance
Pay rate receives a rating of four or five from 87.7% of creators, and brand alignment from 84.8%. Creative freedom receives 64.1%, followed by timeline and effort at 54.0%. The leading factors place the commercial offer and the relevance of the brand at the center of the creator’s decision.
Outreach should provide enough information for a creator to evaluate both. The proposal can state the objective, audience rationale, product, deliverables, fee, rights, and timing in one coherent brief. A clear explanation of fit is particularly useful where the creator needs to judge how the product relates to their existing content and audience. Brands can assess response quality and negotiation friction as part of improving their proposal process.
Show data
Share rating 4 or 5 | |
|---|---|
Pay rate | 87.7 |
Brand alignment | 84.8 |
Creative freedom | 64.1 |
Timeline/effort required | 54 |
Exclusivity terms | 41.7 |
Past experience with the brand | 50.7 |
Figure 4.2. Pay and brand fit lead deal acceptance priorities.
Deal Rejection
Poor brand alignment receives a high rejection rating from 77.0% of creators, low rates from 75.4%, product quality concerns from 69.4%, and bad past experiences from 68.0%. Restrictive briefs receive 47.8%. The responses show why deal screening needs information on the product and relationship as well as the proposed compensation.
Brands should identify potential fit and product concerns before contracting. Early product access, accurate claims, clear expectations, and a defined contact can help creators assess the assignment. Teams should also review the record of prior work together, including payment and approval issues. Where a concern remains unresolved, recording the reason helps distinguish a budget constraint from a product, audience, or execution issue in future outreach.
Show data
Share rating 4 or 5 | |
|---|---|
Low rates | 75.4 |
Poor brand alignment | 77 |
Restrictive creative briefs | 47.8 |
Product quality concerns | 69.4 |
Tight deadlines | 25.5 |
Bad past experiences | 68 |
Figure 4.3. Brand fit and product quality are central screening criteria.
Pricing Methods
Time and effort is the most commonly selected pricing method, at 76.6%. Follower count receives 51.1%, engagement 46.8%, and previous brand benchmarks 30.0%. The result gives production requirements a clear role in rate discussions, alongside the scale and response of the audience reached.
A comparable quotation should define the number and type of assets, filming requirements, revisions, usage rights, exclusivity, and publication obligations. This makes it easier to understand why fees differ and to compare proposals with similar scope. The supplied surveys provide evidence on pricing inputs and annual income bands. Establishing a fee benchmark for a specific deliverable requires normalized contract or transaction data that identifies the work and rights covered.
Show data
Share of creators | |
|---|---|
Flat rate based on time/effort | 76.6 |
Based on follower count | 51.1 |
Based on engagement | 46.8 |
Based on past brand benchmarks | 30 |
Based on market demand | 29.6 |
Other | 7.8 |
Figure 4.4. Production time is the most common pricing input.
Brand Support
Higher pay is selected by 82.1% of creators as support that would help produce better-performing content. Creative freedom receives 73.7% and clear expectations and briefs 72.9%. Early product access receives 45.6%, while separate usage fees receive 39.8%. Creators therefore place value on resources, clarity, and discretion within the assignment.
A 2027 brief can define the intended audience action, required product information, substantiated claims, deliverables, rights, and approval process. The creator can then propose the narrative, setting, language, and presentation suited to their audience. Early product access gives that process time to develop. A clear distinction between the essential requirements and the creator’s execution choices can reduce uncertainty during production and provide a more specific basis for reviewing the finished work.
Show data
Share of creators | |
|---|---|
Higher pay | 82.1 |
Creative freedom | 73.7 |
Clear expectations and briefs | 72.9 |
Access to product early | 45.6 |
Usage fees separated from deliverables | 39.8 |
Longer timelines | 31.2 |
Performance insights/analytics | 24.2 |
Other | 1.6 |
Figure 4.5. Creators ask for clear briefs, creative discretion, and sufficient pay.
Repeat Partnerships
Smooth communication is selected by 91.2% of creators as a reason to work with a brand again. Fast payment receives 81.5%, a positive relationship 80.5%, and creative flexibility 73.1%. Audience engagement and clear results also matter, at 45.8% and 43.3%. The strongest selections concern the day-to-day operation of the relationship.
Brands can make repeat work easier to assess by assigning a clear contact, consolidating feedback, specifying approval dates, and agreeing payment terms before production. A renewal discussion should review the campaign evidence alongside the working experience. These operating practices address the priorities creators identify. Measuring their commercial value requires the brand to track repeat participation, delivery quality, and the costs associated with its partnership process.
Show data
Share of creators | |
|---|---|
Smooth communication | 91.2 |
Fast payments | 81.5 |
Positive relationship with the brand | 80.5 |
Creative flexibility | 73.1 |
Strong audience engagement | 45.8 |
Clear results | 43.3 |
Other | 3.3 |
Figure 4.6. Communication and payment speed lead repeat partnership preferences.
Brand Misunderstandings
Creators most often identify production time, at 67.8%, and pricing, at 67.1%, as areas brands misunderstand. Audience expectations receive 49.1% and the creative process 47.8%. The distribution points to a recurring need for a shared definition of the work before an assignment begins.
A scope discussion can identify research, concept development, filming, editing, approvals, revisions, publication, and reporting where those activities apply. The agreed fee and timeline can then be evaluated against that scope. Creators should make material production requirements visible; brands should explain the decisions and constraints that shape the brief. A common scope record gives both parties a concrete basis for managing changes and resolving questions during delivery.
Show data
Share of creators | |
|---|---|
Time required to produce high-quality content | 67.8 |
Pricing and rates | 67.1 |
Audience expectations | 49.1 |
Creative process | 47.8 |
Platform algorithm changes | 42.1 |
Need for creative freedom | 40.9 |
The value of ongoing partnerships | 34.3 |
Other | 2.1 |
Figure 4.7. Production time and pricing create the most reported misunderstandings.
Creator Careers
In the earnings sample, 57.0% describe their work as part-time. In the impact sample, inconsistent income is the most commonly selected career pressure. These conditions influence how creators assess time commitments and commercial opportunities.
Working status, available hours, and business structure give a brief its capacity context. Pairing those details with payment commitments and the creator’s own content schedule helps both parties assess a feasible assignment.
Creator Profile
The earnings sample is concentrated among creators aged 25–34, who account for 53.8%; those aged 35–44 account for 21.8%, and those aged 18–24 for 19.1%. Instagram is the primary platform for 64.8%, followed by TikTok at 27.3%. Lifestyle appears as a content niche for 64.6%, with multiple niches permitted.
These characteristics define where the earnings benchmarks are most directly informative. Brands using the results to assess a different platform, niche, or career group should first compare the available sample with the creators they intend to engage. A specialist program may need additional evidence on that segment’s production requirements and economics. The impact survey provides another creator perspective with its own composition and question design.
Show data
Share of creators | |
|---|---|
64.8 | |
TikTok | 27.3 |
YouTube | 5.7 |
1.1 | |
Twitch | 0.4 |
0.2 | |
Personal Blog/Website | 0.2 |
Substack | 0.2 |
Figure 5.1. Instagram is the primary platform for 64.8% of earnings respondents.
Working Patterns
- 43.0%of the earnings sample are full-time creators
- 40.9%of full-time creators earn above $50,000 annually
- 4.5%of part-time creators earn above $50,000 annually
Full-time creators account for 43.0% of the earnings sample, and 40.9% of that group report annual income above $50,000. Among part-time creators, the corresponding share is 4.5%. Weekly hours show another difference: 53.7% of those reporting forty or more hours earn above $50,000, compared with 4.2% of those reporting zero to ten hours.
Capacity planning should consider the creator’s working model and existing commitments alongside the brief. A demanding project can require time for preparation, production, revisions, and business administration. Creators considering a larger time commitment should assess expected income, costs, and the reliability of their work pipeline. The associations reported here are compatible with several explanations, including audience size, experience, and the ability of higher earners to devote more time to creation.
Show data
Share earning more than $50,000 | |
|---|---|
0–10 hours (n=96) | 4.2 |
10–20 hours (n=179) | 16.8 |
20–30 hours (n=98) | 16.3 |
30–40 hours (n=45) | 35.6 |
40+ hours (n=54) | 53.7 |
Figure 5.2. Higher time commitment is associated with higher annual income.
Education
Higher-education attendance is reported by 77.3% of earnings respondents, with another 10.8% selecting some attendance. Among the 416 follow-up respondents, 39.7% identify employment as a financing source, 36.8% financial aid, 36.8% family support, and 34.4% student loans. Creator work appears as an education-financing source for 10.3%.
The practical career question is which skills and financing arrangements support a creator’s own business goals. The survey identifies varied educational routes and several ways of paying for them. It provides background for understanding respondents’ circumstances. Assessing the financial return from education or recommending a specific qualification would require information on costs, completion, skills, and comparable career outcomes across education groups.
Show data
Share of creators | |
|---|---|
Yes | 77.3 |
No | 11.9 |
Some | 10.8 |
Figure 5.3. Higher education is common in the creator earnings sample.
Business Ownership
Among the 434 respondents answering the ownership question, 44.0% select owning a business or brand and 11.3% select a creator-team LLC. Another 44.7% select no ownership. The separate formation-timing question places 18.7% in the one-to-two-year stage and 12.7% in the two-to-three-year stage of their creator career.
Commercial planning should clarify who supplies the work, who owns the relevant assets, and which entity receives payment. Creators considering an owned product or business need a plan for the additional work it involves, including product development and customer operations. The preference for an owned business as a main income source in Section 1.2 provides context for that decision. The survey’s ownership and formation questions retain their own categories and should be assessed separately.
Show data
Share of creators | |
|---|---|
No | 44.7 |
Yes | 44 |
My content creation team and I are an LLC | 11.3 |
Figure 5.4. Business ownership and creator-team LLCs represent distinct structures.
Success Measures
Engagement is the primary measure of success for 42.6% of earnings respondents, followed by income at 28.0%, community or connection at 18.9%, and follower count at 10.6%. At post level, views are used by 80.5%, while likes, comments, and shares each receive selections from more than half of respondents.
Brands and creators should agree which measures serve the assignment and which describe the creator’s wider goals. Views can establish distribution; comments and saves can inform an assessment of response; purchases require transaction evidence. A shared reporting plan should name the outcome, its denominator, the data source, and the reporting period. This gives the partnership a clearer basis for judging performance and deciding what to repeat.
Show data
Share of creators | |
|---|---|
Engagement | 42.6 |
Income | 28 |
Community / connection | 18.9 |
Follower count | 10.6 |
Figure 5.5. Engagement leads creators’ primary definitions of success.
Career Pressures
Inconsistent income is the hardest part of the career for 41.7% of impact-survey respondents, ahead of algorithm changes at 18.9%, burnout at 16.4%, and pressure to create constantly at 14.8%. In a separate question on performance influences, algorithm changes receive 67.8% and posting frequency 53.6%. Financial stability and content performance therefore need separate attention.
A creator’s capacity plan can bring together contracted work, payment dates, production hours, and time available for their own content. Brands considering ongoing agreements should specify the commitment, scheduling flexibility, and payment cadence so the creator can assess the work. The survey identifies the pressures creators report; assessing whether a particular contract improves stability requires income and workload data over time.
Show data
Share of creators | |
|---|---|
Inconsistent income | 41.7 |
Algorithm changes | 18.9 |
Burnout | 16.4 |
Pressure to create constantly | 14.8 |
Negotiating contracts | 4.3 |
Brand communication | 2.1 |
Other | 1.8 |
Figure 5.6. Income consistency is creators’ most commonly selected career pressure.
Audience and Brand Values
Younger groups in the January consumer module report more creator-influenced product purchases. Offers and product information receive strong purchase-driver selections. Brand values attract both loyalty and potential rejection, with support varying across issues.
A relevant offer and clear product evidence can be assessed alongside the audience’s age, interests, and values. Public-position campaigns require further precision about the specific issue and stance being communicated.
Audience Differences
- 41.9%of Gen Z report creator-influenced product purchases
- 33.7%of Millennials report creator-influenced product purchases
- 17.1%of Gen X report creator-influenced product purchases
Reported product purchases influenced by creators reach 41.9% among Gen Z respondents, 33.7% among Millennials, and 17.1% among Gen X. The 24.8 percentage-point difference between Gen Z and Gen X is larger than the observed 2.7-point female–male difference. Trying food or restaurants follows a similar age pattern within this consumer module.
Brands should examine the age composition of the audience they intend to reach before applying a broad purchase assumption. A creator’s relevance to a particular life stage may matter to the product proposition and content. These cuts describe the survey’s U.S. internet-user population aged 18–64. More detailed targeting decisions need adequate segment bases and evidence specific to the product, audience, and campaign.
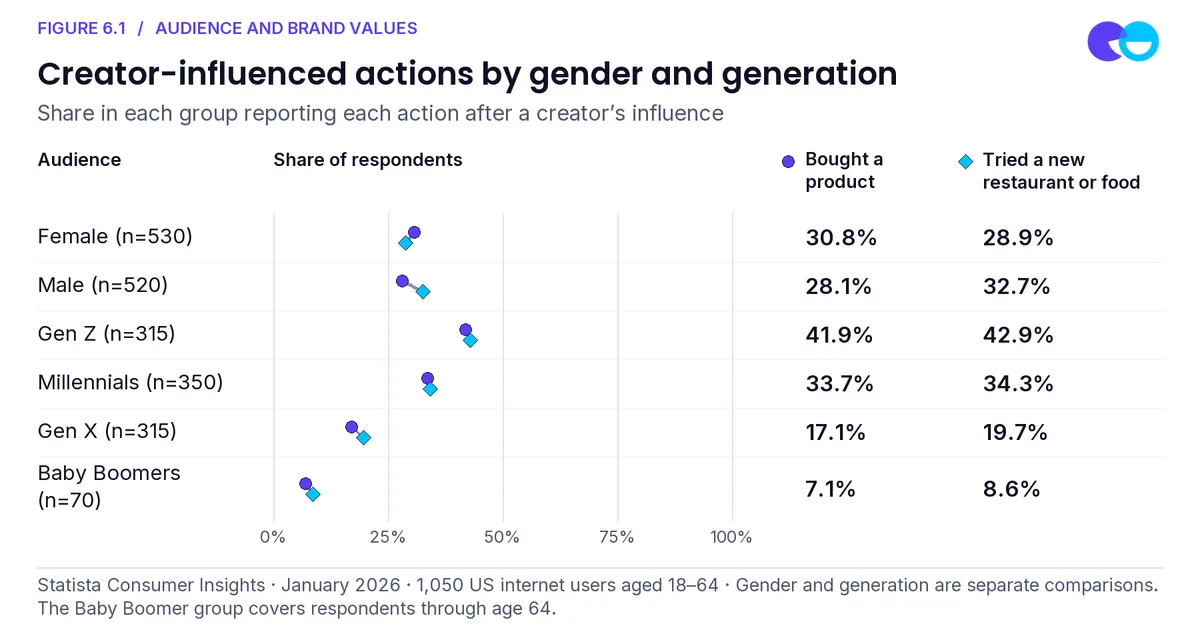
Figure 6.1: Creator-influenced actions by gender and generation
Brand Purchase Drivers
Discounts and promotions receive the most selections as a brand behavior that encourages purchase, at 45.1%. Clear product information and reviews receive 34.7%, authentic content 28.8%, and support for aligned causes or values 22.2%. Trusted creator partnerships receive 16.4%. The findings place the offer and the information needed to evaluate it alongside the choice of messenger.
A creator brief should connect the content with the product page and commercial offer. The customer needs consistent product information, an available item, and a clear next step. Where a promotion is used, the brief should define its terms and timing. Brands can test the content and offer together while tracking the costs and margins relevant to the sale. This makes the commercial proposition easier to evaluate across the campaign.
Show data
Share of consumers | |
|---|---|
Offering discounts or promotions | 45.1 |
Providing clear product information and reviews | 34.7 |
Posting authentic, relatable content | 28.8 |
Supporting causes or values I believe in | 22.2 |
Sharing customer testimonials or success stories | 21.4 |
Limited-time product drops or exclusives | 18.3 |
Consistently posting new content | 15.5 |
Partnering with creators I trust | 16.4 |
Engaging with followers in comments or messages | 15.1 |
None of the above | 16.7 |
Figure 6.2. Offers and product information lead stated brand purchase drivers.
Brand Positions
In the brand-values module, 50.6% agree that a brand’s values and public positions make them more loyal, and 48.1% say they would boycott a brand over a position they disagree with. Another 47.2% consider those values and positions before purchase. On the general question of whether brands should take a public stand, agreement is 42.9% and disagreement 41.3%.
Values-based partnership decisions should specify the audience, issue, product relationship, and position being communicated. Brands and creators can assess whether their stated values and proposed content are compatible before entering an agreement. The close overall split makes audience-specific research particularly useful. The module measures general brand attitudes; a forecast of campaign response requires evidence on the actual message and the people exposed to it.
Show data
Share agreeing | |
|---|---|
Brands should take a public stand on social and political issues | 42.9 |
I consider a brand's values and public stand on social and political issues before making a purchase | 47.2 |
I am more loyal to a brand because of its values and public stand on social and political issues | 50.6 |
I would boycott a brand for taking a public stand on social and political issues with which I disagree | 48.1 |
Figure 6.3. Brand values feature in loyalty and boycott intentions.
Issue Priorities
Agreement that brands should take a public position is highest for free speech at 60.5%, mental health at 59.3%, and climate change at 57.0%. Political candidates receive 33.3% and religion 32.8%. The detailed responses also show disagreement above fifty percent for those latter two subjects. Values-based content therefore needs an issue-specific assessment.
A campaign involving a public position should define the subject and intended audience precisely. Support for discussing an issue leaves open how consumers will respond to a particular stance, creative treatment, or spokesperson. Brands and creators can use research on the specific position and audience to assess relevance and possible disagreement. The full agree, disagree, and uncertain distributions provide a more complete starting point than a single agreement percentage.
Show data
Share agreeing | |
|---|---|
Mental health | 59.3 |
Climate change | 57 |
Diversity, equity, and inclusion | 55.2 |
Free speech | 60.5 |
Immigration policy | 40.5 |
International conflicts | 35.3 |
Religion | 32.8 |
Political candidates | 33.3 |
LGBTQ+ issues | 36.2 |
Racial issues | 48.7 |
Figure 6.4. Support for public brand positions varies by issue.
2027 Planning Priorities
The evidence identifies several decisions that brands, agencies, and creators can make explicit in their 2027 plans. These priorities translate the supplied research into a practical agenda. Their value should be assessed against the objectives, economics, and audiences of the program being developed.
Define the audience and action
Specify who the campaign needs to reach and what action it should produce. Use category and age evidence to frame the audience hypothesis, then validate that hypothesis with the brand’s own research or campaign data. A product purchase, restaurant visit, app download, and repeat use each require different information and observation periods. Keep the outcome visible through creator selection, briefing, and reporting.
Make partnership economics explicit
Describe the production work, publication requirements, rights, revisions, exclusivity, fee, and payment schedule. Creators’ reliance on sponsorship, use of time and effort in pricing, and concerns about income consistency make these terms important planning inputs. A clear scope allows both parties to assess whether the assignment is commercially workable and provides a basis for discussing changes during delivery.
Build a clear route from content to purchase
Connect the product explanation with an available item, accurate information, a functioning link, and a defined next step. Test repeated exposure and delayed response where they are relevant to the product. If measured results show that consideration extends beyond the first interaction, the evaluation should capture the later actions that matter to the business. Keep discovery surfaces, delivered exposure, and checkout channels distinguishable in the data.
Test creative choices against the product need
Use short video, everyday context, storytelling, demonstrations, or direct paid treatments as explicit hypotheses. Define the purchase question each treatment is intended to answer. Compare variants with suitable audience and exposure measures, and include production and distribution costs in the assessment. If one treatment produces stronger measured outcomes under comparable conditions, it provides a basis for the next test or allocation.
Make repeat work operationally reliable
Assign a clear contact, consolidate feedback, agree approval dates, and administer payment as contracted. Creators identify these working conditions as prominent reasons to return. Track the quality of delivery and the creator’s experience alongside campaign results. A renewal decision can then consider whether the partnership meets its commercial objective and whether the operating process supports another assignment.
Use forecasts with explicit assumptions
A quantified 2027 forecast needs a defined market, period, addressable audience, activity level, conversion assumption, cost base, and uncertainty range. The supplied surveys can inform selected hypotheses about income, preferences, and partnership conditions. Numerical forecasts for industry spending, campaign ROI, or incremental sales require additional market or campaign evidence. Conditional scenarios should show which assumptions change the result and what evidence would justify revising them.
Conclusion: The Value We Build in 2027
Our research gives us a practical starting point for the creator economy’s next chapter: the quality of the relationship between creators, audiences, and brands.
For creators, that relationship has economic consequences. Brand deals are the main revenue source for 70.3% of respondents answering our detailed earnings questions. In our separate creator impact study, inconsistent income is the most commonly identified career challenge. These findings place compensation, production requirements, and payment commitments at the center of a workable partnership.
The terms of that partnership also shape the work an audience receives. Creators place considerable importance on brand alignment, creative freedom, and clear expectations. Brands have an opportunity to define the product information and commercial objective precisely, then give creators sufficient room to communicate through the approaches they understand and use.
For audiences, the value of a recommendation rests partly in what it helps them understand or do. Our consumer research identifies demand for relatable advertising, product demonstrations, and information that addresses a relevant problem. These preferences give the industry a concrete standard against which to assess its content: the usefulness of the information and the quality of the decision it supports.
The commercial response remains uneven. While 44.8% of surveyed consumers report at least one monthly purchase based on creator suggestions, 48.7% report zero. Audience relevance, product fit, and the path to purchase therefore deserve explicit attention in every campaign. Brands need evidence connecting their investment with the outcome they intend to produce.
The same discipline should guide decisions about AI. A recommendation needs a clear basis for its product claims and the experience it represents. As brands and creators consider generated content, they should examine how audiences understand its origin, assess its credibility, and respond to it.
We believe the industry’s 2027 agenda should make these responsibilities tangible. That means commercially workable agreements, credible recommendations, reliable payment, and measurement suited to the intended outcome. The choices made in individual partnerships give those principles practical effect.
The creator economy we want to help build gives audiences useful information, gives creators a viable basis for their work, and gives brands evidence of the value their investment produces. That is the standard against which we believe its next chapter should be judged.
Supporting Research
The following tables provide additional context on creator composition, commercial activity, media behavior, and brand attitudes. Each retains its own survey population, question, and base. The accompanying notes identify how the distribution can inform 2027 planning.
Location
California, Florida, Texas, and New York account for 47.2% of earnings respondents combined. This concentration helps define the sample’s geographic context. A location-specific 2027 program should compare its intended creator market with the respondents represented here.
Response | Count | Share |
|---|---|---|
California | 85 | 18.0% |
Florida | 54 | 11.4% |
Texas | 47 | 10.0% |
New York | 37 | 7.8% |
Georgia | 25 | 5.3% |
Illinois | 23 | 4.9% |
North Carolina | 21 | 4.4% |
Arizona | 18 | 3.8% |
New Jersey | 16 | 3.4% |
Massachusetts | 15 | 3.2% |
Michigan | 12 | 2.5% |
Ohio | 12 | 2.5% |
Maryland | 11 | 2.3% |
Washington | 10 | 2.1% |
Colorado | 9 | 1.9% |
Nevada | 9 | 1.9% |
Pennsylvania | 8 | 1.7% |
South Carolina | 6 | 1.3% |
Washington, D.C. | 5 | 1.1% |
Conneticut | 5 | 1.1% |
Missouri | 5 | 1.1% |
Virginia | 4 | 0.8% |
Indiana | 4 | 0.8% |
Minnesita | 4 | 0.8% |
Kentucky | 4 | 0.8% |
Tennessee | 4 | 0.8% |
Hawaii | 4 | 0.8% |
Utah | 4 | 0.8% |
Kansas | 3 | 0.6% |
Alabama | 2 | 0.4% |
Oregon | 1 | 0.2% |
Arkansas | 1 | 0.2% |
Oklahoma | 1 | 0.2% |
United States Virgin Islands | 1 | 0.2% |
Puerto Rico | 1 | 0.2% |
Lousiana | 1 | 0.2% |
Source: NeoReach Creator Earnings Survey 2026 (E). Form Responses 1!G:G. Base n=472. Single response.
Content niches
Lifestyle receives 64.6% of earnings-sample selections, while travel and fashion each receive about one quarter. Multiple niches can describe the same creator. For a specialist 2027 brief, niche-specific production and commercial evidence will improve the relevance of the comparison.
Response | Count | Share |
|---|---|---|
Lifestyle | 305 | 64.6% |
Travel | 121 | 25.6% |
Fashion | 120 | 25.4% |
Food & Drink | 106 | 22.5% |
Entertainment | 105 | 22.2% |
Beauty | 98 | 20.8% |
Health & Wellness | 95 | 20.1% |
Family | 65 | 13.8% |
Fitness | 62 | 13.1% |
Comedy | 58 | 12.3% |
Sports | 44 | 9.3% |
Other | 43 | 9.1% |
Music | 33 | 7.0% |
Gaming | 30 | 6.4% |
Education | 30 | 6.4% |
Photography | 27 | 5.7% |
Art | 25 | 5.3% |
News/Politics/Current Events | 20 | 4.2% |
Business | 17 | 3.6% |
Automotive | 12 | 2.5% |
Tech | 12 | 2.5% |
Source: NeoReach Creator Earnings Survey 2026 (E). Form Responses 1!I:I. Base n=472. Multi-select; shares can exceed 100%.
Business formation timing
The formation question places 18.7% of detailed respondents at one to two years into their creator career and 12.7% at two to three years. Its categories provide context for business planning and should be kept separate from the ownership-status question.
Response | Count | Share |
|---|---|---|
I did not start a business/brand/LLC | 211 | 48.6% |
1-2 years into being a creator | 81 | 18.7% |
2-3 years into being a creator | 55 | 12.7% |
5+ years into being a creator | 37 | 8.5% |
3-4 years into being a creator | 33 | 7.6% |
4-5 years into being a creator | 17 | 3.9% |
Source: NeoReach Creator Earnings Survey 2026 (E). Form Responses 1!AP:AP. Base n=434. Single response.
Combined following
In the impact sample, 22.6% report 10,000–50,000 combined followers and 20.5% report 100,000–250,000. Combined follower bands describe potential scale across channels; audience overlap and relevance require separate assessment for a 2027 partnership.
Response | Count | Share |
|---|---|---|
10K–50K | 110 | 22.6% |
100K–250K | 100 | 20.5% |
50K–100K | 75 | 15.4% |
250K–500K | 69 | 14.2% |
Under 10K | 48 | 9.9% |
500K–1M | 42 | 8.6% |
1M-5M | 36 | 7.4% |
5M–10M | 5 | 1.0% |
10M+ | 2 | 0.4% |
Source: NeoReach Creator Impact Survey 2026 (I). Form Responses 1!E:E. Base n=487. Single response.
Primary niche
Lifestyle is the primary niche for 26.3% of impact respondents, followed by entertainment and pop culture at 11.3%. This is a single-choice niche question. The earnings survey permits several niches, so the two distributions retain their own meanings.
Response | Count | Share |
|---|---|---|
Lifestyle | 128 | 26.3% |
Entertainment / Pop Culture | 55 | 11.3% |
Beauty / Skincare | 45 | 9.2% |
Fashion / Style | 43 | 8.8% |
Other | 40 | 8.2% |
Travel | 36 | 7.4% |
Food & Cooking | 30 | 6.2% |
Gaming | 20 | 4.1% |
Art / Creative | 20 | 4.1% |
Fitness / Wellness | 17 | 3.5% |
Home / DIY | 14 | 2.9% |
Parenting / Family | 12 | 2.5% |
Tech / Gadgets | 11 | 2.3% |
Education | 11 | 2.3% |
Finance / Business | 5 | 1.0% |
Source: NeoReach Creator Impact Survey 2026 (I). Form Responses 1!F:F. Base n=487. Single response.
Brand-income share
Brand work supplies up to one quarter of income for 47.4% of impact respondents, while 17.9% place it in the 76–100% range. This variation supports asking each creator about their commercial model when assessing exclusivity and the commitment required by an ongoing agreement.
Response | Count | Share |
|---|---|---|
0–25 percent | 231 | 47.4% |
26–50 percent | 93 | 19.1% |
76–100 percent | 87 | 17.9% |
51–75 percent | 76 | 15.6% |
Source: NeoReach Creator Impact Survey 2026 (I). Form Responses 1!G:G. Base n=487. Single response.
Monthly partnerships
A combined 82.1% of impact respondents report one to five monthly partnerships. The measure counts relationships. A 2027 capacity assessment also needs the deliverables, production work, and overlapping commitments attached to those relationships.
Response | Count | Share |
|---|---|---|
1–2 | 228 | 46.8% |
3–5 | 172 | 35.3% |
6–10 | 42 | 8.6% |
0 | 26 | 5.3% |
10+ | 19 | 3.9% |
Source: NeoReach Creator Impact Survey 2026 (I). Form Responses 1!U:U. Base n=487. Single response.
Performance pressures
Algorithm changes receive 67.8% of selections as an influence on content performance, and posting frequency 53.6%. A 2027 plan should record the creator’s production capacity and use campaign evidence to assess how delivery conditions relate to the intended outcome.
Response | Count | Share |
|---|---|---|
Algorithm changes | 330 | 67.8% |
Posting frequency | 261 | 53.6% |
Brand alignment/fit | 156 | 32.0% |
Trend alignment | 136 | 27.9% |
Audience behavior shifts | 124 | 25.5% |
Other | 34 | 7.0% |
Source: NeoReach Creator Impact Survey 2026 (I). Form Responses 1!AA:AA. Base n=487. Multi-select; shares can exceed 100%.
Creator platforms
TikTok and Instagram are used by 87.5% and 86.9% of impact respondents, with YouTube at 55.0%. Multiple selections show overlapping platform participation. These figures provide context for the sample’s format and action assessments.
Response | Count | Share |
|---|---|---|
TikTok | 426 | 87.5% |
423 | 86.9% | |
YouTube | 268 | 55.0% |
Other | 72 | 14.8% |
62 | 12.7% | |
Snapchat | 46 | 9.4% |
X | 40 | 8.2% |
Source: NeoReach Creator Impact Survey 2026 (I). Form Responses 1!D:D. Base n=487. Multi-select; shares can exceed 100%.
Live Streams
Live viewing during the original broadcast is reported by 32.8%, and replay viewing by 28.4%. Livestream plans can define the role of the live interaction and the recording separately, with an outcome and production requirement for each.
Response | Count | Share |
|---|---|---|
Yes, I produce and broadcast video live streams | 1517 | 17.6% |
Yes, I watch video live streams during the original broadcast | 2821 | 32.8% |
Yes, I watch video live streams later (after the original broadcast has ended) | 2447 | 28.4% |
No, I do not use any video live stream services | 3784 | 43.9% |
Source: Statista Consumer Insights, Global survey; export prepared for NeoReach (S3). Export: Global_202601!A76:D89. Table base n=8,613. Multiple responses allowed.
Creator Content Interests
Comedy, food and cooking, and movies and television lead listed creator-content interests at 42.8%, 41.8%, and 38.9%. For 2027, product relevance should be assessed within the interests of the intended audience and the creator’s actual content.
Response | Count | Share |
|---|---|---|
Adult content | 2216 | 25.7% |
Advice & self-help | 2086 | 24.2% |
Animals & nature | 2300 | 26.7% |
Business & economy | 1694 | 19.7% |
Cars & vehicles | 1871 | 21.7% |
Comedy | 3690 | 42.8% |
Family & parenting | 1674 | 19.4% |
Finance | 1547 | 18.0% |
Food & cooking | 3603 | 41.8% |
Gaming & e-sports | 1852 | 21.5% |
Health & fitness | 2271 | 26.4% |
History | 1534 | 17.8% |
Love & relationships | 1636 | 19.0% |
Movies & TV | 3349 | 38.9% |
Music | 3241 | 37.6% |
News & politics | 1736 | 20.2% |
Religion & philosophy | 1010 | 11.7% |
Science & technology | 1477 | 17.1% |
Shopping & product reviews | 1662 | 19.3% |
Society & culture | 1183 | 13.7% |
Sports | 2006 | 23.3% |
True crime & law | 1770 | 20.6% |
VIPs & celebrities | 716 | 8.3% |
Other | 263 | 3.1% |
Don't know | 157 | 1.8% |
I do not take in any content from influencers / content creators | 844 | 9.8% |
Source: Statista Consumer Insights, Global survey; export prepared for NeoReach (S3). Export: Global_202601!A90:D124. Table base n=8,613. Multiple responses allowed.
Time on Social Media
Time spent on social media spans brief visits and several hours of daily use. The largest individual category is one to two hours at 19.6%. Campaign planning needs evidence on delivered reach and attention within the selected audience and content environment.
Response | Count | Share |
|---|---|---|
Less than 5 minutes | 712 | 5.4% |
5-15 minutes | 1638 | 12.3% |
16-30 minutes | 2317 | 17.4% |
31-60 minutes | 2452 | 18.4% |
1-2 hours | 2604 | 19.6% |
2-3 hours | 1569 | 11.8% |
3-5 hours | 1092 | 8.2% |
5-8 hours | 506 | 3.8% |
More than 8 hours | 406 | 3.1% |
Source: Statista Consumer Insights, Media survey; export prepared for NeoReach (S4). Export: Media_202512!A6:D24. Table base n=13,296. Single-pick.
Social Devices
Smartphones are used for social media by 80.1% of the social-user base, compared with 30.4% for laptops and 28.0% for tablets. A 2027 execution plan can check video legibility, product information, links, and purchase steps on the devices relevant to its audience.
Response | Count | Share |
|---|---|---|
Desktop PC | 2451 | 18.4% |
Gaming console (e.g., PlayStation, Xbox) | 1053 | 7.9% |
Laptop | 4047 | 30.4% |
Smartphone | 10651 | 80.1% |
Streaming device (e.g., Amazon Fire TV stick, Chromecast) | 1090 | 8.2% |
Tablet | 3726 | 28.0% |
TV set (incl. smart TV) | 1577 | 11.9% |
Video projector | 468 | 3.5% |
Other | 213 | 1.6% |
Source: Statista Consumer Insights, Media survey; export prepared for NeoReach (S4). Export: Media_202512!A25:D43. Table base n=13,296. Multiple responses allowed.
Product Inspiration
Friends and acquaintances receive 50.1% of product-inspiration selections, advertisements 43.6%, and creators 23.2%. Creator content operates within a broader set of influences. Measurement should define the contribution the campaign is designed to assess.
Response | Count | Share |
|---|---|---|
Directly in the physical store | 5671 | 39.3% |
Directly in the online shop | 4201 | 29.1% |
Advertisements | 6301 | 43.6% |
Friends and acquaintances | 7237 | 50.1% |
Celebrities | 2170 | 15.0% |
Influencers / content creators | 3354 | 23.2% |
Coupon and deal platforms | 2860 | 19.8% |
Online forums | 2941 | 20.4% |
Movies, TV shows & music | 5037 | 34.9% |
Other | 649 | 4.5% |
None of the above | 828 | 5.7% |
Source: Statista Consumer Insights, Media survey; export prepared for NeoReach (S4). Export: Media_202512!A44:D63. Table base n=14,445. Multiple responses allowed.
Brand Positions: Full Responses
The full distributions make disagreement and uncertainty visible for each issue. For a 2027 campaign, the relevant research question concerns the specific position, audience, and message. Agreement with discussing an issue leaves the response to a particular stance open to further assessment.
Issue | Agree | Disagree | Don’t know |
|---|---|---|---|
Public stand overall | 42.9% | 41.3% | 15.9% |
Mental health | 59.3% | 29.4% | 11.3% |
Climate change | 57.0% | 31.7% | 11.3% |
Diversity, equity and inclusion | 55.2% | 34.5% | 10.2% |
Free speech | 60.5% | 28.6% | 10.9% |
Immigration policy | 40.5% | 45.2% | 14.3% |
International conflicts | 35.3% | 49.4% | 15.4% |
Religion | 32.8% | 53.9% | 13.3% |
Political candidates | 33.3% | 52.4% | 14.3% |
LGBTQ+ issues | 36.2% | 48.8% | 15.0% |
Racial issues | 48.7% | 39.8% | 11.5% |
Source: Statista Consumer Insights, Pulse November 2025; export prepared for NeoReach (S2). Export: Pulse_202511!A40:D181. Each issue base n=2,050. Percentages recomputed from exported counts; rounding can prevent totals equaling 100%.
Income among creators who earned through each source
In the NeoReach earnings survey, 434 creators answered each item. Median bands use only creators who reported positive income from that source in the preceding 12 months. Groups with fewer than 30 earners are exploratory.
Revenue source | Earners | Median income band among earners |
|---|---|---|
Instagram deals | 379 | $2,501-$5,000 |
Meta native payouts | 267 | $501-$1,000 |
TikTok deals | 285 | $1,001-$2,500 |
TikTok native payouts | 232 | $501-$1,000 |
YouTube deals | 96 | $1,001-$2,500 |
YouTube native payouts | 108 | $1,001-$2,500 |
Twitch deals | 20 | $1,001-$2,500 |
Twitch native payouts | 26 | $501-$1,000 |
Snapchat deals | 19 | $501-$1,000 |
Snapchat native payouts | 17 | $251-$500 |
Fan monetization platforms | 48 | $501-$1,000 |
Affiliate programs | 225 | $251-$500 |
Median annual creator income by following and management
The NeoReach earnings survey included 472 creators. Each median uses the creators in the indicated group. Groups with fewer than 30 creators are exploratory. The two groupings describe the same sample.
Grouping | Creator group | Creators | Median annual income band |
|---|---|---|---|
Combined following | Under 10K | 30 | $0-$5,000 |
Combined following | 10K–50K | 148 | $5,001-$10,000 |
Combined following | 50K–100K | 81 | $10,001-$15,000 |
Combined following | 100K–250K | 88 | $10,001-$15,000 |
Combined following | 250K–500K | 54 | $15,001-$25,000 |
Combined following | 500K–1M | 37 | $35,001-$50,000 |
Combined following | 1M-5M | 27 | $50,001-$75,000 |
Combined following | 5M-10M | 4 | $150,001-$175,000 |
Combined following | 10M+ | 3 | $125,001-$150,000 |
Management | Independent | 404 | $5,001-$10,000 |
Management | Represented | 68 | $50,001-$75,000 |
Average ratings for accepting and declining brand deals
In the NeoReach impact survey, 487 creators rated each factor separately on a five-point ordinal scale. The averages summarize responses within each question.
Question | Factor | Mean rating out of 5 |
|---|---|---|
Importance when accepting | Pay rate | 4.40 |
Importance when accepting | Brand alignment | 4.32 |
Importance when accepting | Creative freedom | 3.83 |
Importance when accepting | Timeline/effort required | 3.55 |
Importance when accepting | Exclusivity terms | 3.18 |
Importance when accepting | Past experience with the brand | 3.32 |
Likelihood of declining | Low rates | 4.14 |
Likelihood of declining | Poor brand alignment | 4.13 |
Likelihood of declining | Restrictive creative briefs | 3.41 |
Likelihood of declining | Product quality concerns | 3.90 |
Likelihood of declining | Tight deadlines | 2.78 |
Likelihood of declining | Bad past experiences | 3.87 |
Creator age, gender identity and main platform for sponsored work
The NeoReach earnings survey included 472 creators. Age and main sponsored platform allowed one answer. Creators could select multiple gender identities.
Measure | Response | Creators | Share |
|---|---|---|---|
Age | 25-34 | 254 | 53.8% |
Age | 35-44 | 103 | 21.8% |
Age | 18-24 | 90 | 19.1% |
Age | 45-54 | 21 | 4.4% |
Age | 55-64 | 3 | 0.6% |
Age | 65+ | 1 | 0.2% |
Gender identity | Cisgender woman | 283 | 60.0% |
Gender identity | Cisgender man | 135 | 28.6% |
Gender identity | Prefer not to disclose | 42 | 8.9% |
Gender identity | Gender non-conforming | 11 | 2.3% |
Gender identity | Transgender man | 2 | 0.4% |
Gender identity | Transgender woman | 1 | 0.2% |
Main sponsored platform | 301 | 63.8% | |
Main sponsored platform | TikTok | 134 | 28.4% |
Main sponsored platform | YouTube | 21 | 4.4% |
Main sponsored platform | Other | 10 | 2.1% |
Main sponsored platform | Blog | 3 | 0.6% |
Main sponsored platform | 3 | 0.6% |
Annual income by work status, experience and share of video content
The NeoReach earnings survey included 472 creators. Sample share uses all 472 respondents. Income share uses the number of creators in each row. Groups below 30 are exploratory.
Measure | Group | Creators | Sample share | In group earning over $50,000 |
|---|---|---|---|---|
Career status | Part-time | 269 | 57.0% | 4.5% |
Career status | Full-time | 203 | 43.0% | 40.9% |
Experience | 5+ years | 196 | 41.5% | 25.5% |
Experience | 3-4 years | 134 | 28.4% | 18.7% |
Experience | 1-2 years | 72 | 15.3% | 4.2% |
Experience | 4-5 years | 48 | 10.2% | 29.2% |
Experience | Less than 1 year | 22 | 4.7% | 13.6% |
Video share | 75-100% video | 211 | 44.7% | 19.9% |
Video share | 50-75% video | 85 | 18.0% | 17.6% |
Video share | 100% video | 71 | 15.0% | 28.2% |
Video share | 25-50% video | 62 | 13.1% | 17.7% |
Video share | 0-25% video | 43 | 9.1% | 16.3% |
Weekly hours spent on creator work
Share of all 472 creators in the NeoReach earnings survey. Figure 5.2 reports the share earning more than $50,000 within each hours group.
Weekly hours | Share of earnings respondents |
|---|---|
10-20 | 37.9% |
20-30 | 20.8% |
0-10 | 20.3% |
40+ | 11.4% |
30-40 | 9.5% |
Education and financing among follow-up respondents
Each follow-up question had 416 responses in the NeoReach earnings survey. Education and financing permitted multiple answers. Degree relevance used a 1–5 scale with unspecified verbal endpoints.
Measure | Response | Creators | Share of 416 |
|---|---|---|---|
Highest education | 4-year university | 246 | 59.1% |
Highest education | Graduate school | 90 | 21.6% |
Highest education | Community college | 61 | 14.7% |
Highest education | Other | 30 | 7.2% |
Highest education | Trade school | 25 | 6.0% |
Highest education | Medical school (any kind of doctoral program, nursing school, etc.) | 12 | 2.9% |
Highest education | PhD program | 6 | 1.4% |
Education financing | Part-time or full-time job | 165 | 39.7% |
Education financing | Financial aid | 153 | 36.8% |
Education financing | Supported by family | 153 | 36.8% |
Education financing | Student loans | 143 | 34.4% |
Education financing | Scholarships | 133 | 32.0% |
Education financing | Being a creator | 43 | 10.3% |
Education financing | Work-study | 36 | 8.7% |
Education financing | Other | 25 | 6.0% |
Degree relevance / 5 | 1.0 | 153 | 36.8% |
Degree relevance / 5 | 3.0 | 81 | 19.5% |
Degree relevance / 5 | 4.0 | 64 | 15.4% |
Degree relevance / 5 | 5.0 | 64 | 15.4% |
Degree relevance / 5 | 2.0 | 54 | 13.0% |
Postponed/dropped out | No | 380 | 91.3% |
Postponed/dropped out | Yes | 36 | 8.7% |
Creators’ motivations and the metrics they use for individual posts
The NeoReach earnings survey included 472 creators. Each selected one primary motivation and could select multiple post metrics.
Measure | Response | Creators | Share |
|---|---|---|---|
Motivation | I care most about connecting with my audience | 162 | 34.3% |
Motivation | I care most about creating the best content I can | 147 | 31.1% |
Motivation | I care most about making money from my content | 104 | 22.0% |
Motivation | I care most about building a following | 59 | 12.5% |
Post metrics | Views | 380 | 80.5% |
Post metrics | Likes | 290 | 61.4% |
Post metrics | Comments | 279 | 59.1% |
Post metrics | Shares | 274 | 58.1% |
Post metrics | Saves | 216 | 45.8% |
Post metrics | Watch time | 208 | 44.1% |
Post metrics | Other | 11 | 2.3% |
Consumers reporting none of the listed creator-influenced actions
Statista Consumer Insights, January 2026, surveyed 1,050 U.S. internet users aged 18–64. Shares use the indicated group base. Gender and generation are separate comparisons. Baby Boomers are represented only through age 64.
Audience | Respondents | Selected none of the listed actions |
|---|---|---|
Female | 530 | 45.7% |
Male | 520 | 44.6% |
Gen Z | 315 | 21.0% |
Millennials | 350 | 41.4% |
Gen X | 315 | 65.7% |
Baby Boomers | 70 | 80.0% |
Research Notes
Source Coverage
Code | Source | Fieldwork / base |
|---|---|---|
E | NeoReach Creator Earnings Survey 2026 · Creator Earnings 2026 Survey (Responses).xlsx | 516 submissions; 472 retained emails. 14 May–8 November 2026 |
I | NeoReach Creator Impact Survey 2026 · Influencer Impact Survey (Creator-Facing) (Responses).xlsx · Used in NeoReach’s Creator Impact Report 2026 | 539 submissions; 487 retained emails. 21 January–3 March 2026 |
S1 | Statista Consumer Insights, Pulse January 2026 · Used in NeoReach’s Creator Impact Report 2026 | 13–20 January 2026. U.S. internet users 18–64; n=1,050. |
S2 | Statista Consumer Insights, Pulse November 2025 · Export prepared for NeoReach | 10 June–22 October 2025. U.S. internet users 18–64. Footer n=12,297; included question bases n=2,050. |
S3 | Statista Consumer Insights, Global January 2026 · Export prepared for NeoReach | Four waves, 1 January–17 December 2025. U.S. internet users 18–64. Bases 60,261; 8,610; 8,613 depending on question. |
S4 | Statista Consumer Insights, Media December 2025 · Export prepared for NeoReach | 17 June–29 December 2025. U.S. internet users 14–98. Base 14,445; social-user questions 13,296. |
Source attribution: The creator surveys are credited to NeoReach. The January 2026 consumer study was supplied via Statista and used in NeoReach’s Creator Impact Report 2026. The additional consumer modules are Statista Consumer Insights research from the export prepared for NeoReach. These labels distinguish the data source from report publication and export delivery. Commissioning and ownership terms are not established by the workbook.