In NeoReach’s 2026 Creator Earnings Survey, shows that 50.2% of earn less than 10,,000 USD a year.
Half of surveyed creators report $10,000 or less a year
In NeoReach’s 2026 Creator Earnings Survey, 50.2% of respondents selected annual creator-income brackets up to $10,000. For an influencer marketing team, the practical issue is how to structure work that is worth a creator’s time and delivers what the brand needs.

Show data
Share reporting $10,000 or less | |
|---|---|
All surveyed creators | 50.2 |
Full-time | 25.6 |
Part-time | 68.8 |
Instagram-primary | 53.3 |
TikTok-primary | 50.4 |
Managed | 20.6 |
Independent | 55.2 |
Start with the work you are buying: production, deliverables, revisions, usage rights and exclusivity. Put the fee and payment date in the brief. If you need content throughout a launch, discuss the booking schedule early and make the commitment clear.
Use this profile to sharpen your commercial planning. Annual creator income does not set the price of a campaign. Evaluate audience fit, creative quality and the scope you are commissioning, then agree terms that let the creator deliver it well.
The findings that should change the next brief
Clear commercial terms matter. In 2026, 50.2% of surveyed creators selected annual creator-income brackets up to $10,000. Scope the production, revisions and rights before negotiating a fee, and agree payment timing up front. The practical question is whether the partnership pays fairly for the work required.
Commercial motivation becomes more prominent in both groups. Money-focused answers rise from 13.6% to 25.6% among full-time creators and from 11.8% to 19.3% among part-time creators, using harmonized approach/motivation choices. A brief built entirely around exposure may miss what these respondents value. State the fee, deliverables, rights and payment timing before asking for extensive unpaid concept work.
Success and motivation are different questions. Income remains the primary success measure for 28.0% in each full sample, while engagement rises from 36.7% to 42.6%. A creator can care more about earning money while judging individual progress through audience response. Your campaign reporting should connect those perspectives without pretending that likes equal sales.
Know which creators the benchmark represents. The 2026 earnings survey includes 472 creators. Of those, 43.0% work full-time and 64.8% identify Instagram as their primary platform. Use that profile to judge how relevant the findings are to the creators you plan to book.
- 472creators in the 2026 earnings survey
- 43.0%work full-time
- 64.8%identify Instagram as their primary platform
Partnership quality remains a concrete operating issue. In separate 2026 research, 84.8% of creators rate brand alignment highly when accepting a deal, and 76.6% select time and effort as a pricing consideration. These are current context, not annual comparisons. They point to a practical discipline: negotiate the actual production job, the product fit and the rights you need.
- 84.8%of creators rate brand alignment highly when accepting a deal
- 76.6%select time and effort as a pricing consideration
Who took part in the 2026 creator survey
NeoReach’s 2026 Creator Earnings Survey includes 472 creators. Full-time creators account for 43.0% of respondents and part-time creators for 57.0%. Both groups belong in a practical view of the creator market: a part-time publishing schedule can still produce highly relevant content for a brand.
Show data
Share of respondents | |
|---|---|
Full-time | 43 |
Part-time | 57 |
Use work status as context when planning a partnership. Confirm availability, production lead times and the approval schedule with each creator. A full-time designation alone cannot tell your team whether someone has capacity for a launch.
Creators’ primary platforms in 2026
Instagram is the primary platform for 64.8% of respondents, followed by TikTok at 27.3% and YouTube at 5.7%. These figures describe the survey participants. They help readers understand the platform context behind the findings.
Show data
Share of respondents | |
|---|---|
64.8 | |
TikTok | 27.3 |
YouTube | 5.7 |
1.1 | |
Twitch | 0.4 |
Other / mixed primary platform | 0.6 |
For your next shortlist, go deeper than the platform label. Review the creator’s content format, audience fit and ability to explain your product. Use the survey profile to assess the relevance of a benchmark, then make the booking decision around the campaign.
Read the years as survey waves
The 2025 wave was collected from December 16, 2024 to April 2, 2025. The 2026 earnings wave was collected from May 14 to November 8, 2026. Charts labeled 2025 and 2026 compare those waves. They do not represent complete calendar-year financial statements, and the distance between individual responses varies.
The annual-income question is identical in both instruments: respondents describe their average annual income from a creator career. The later response brackets are more detailed. We combine them into the older broad bands and retain the ambiguity at shared older endpoints. That supports a distribution comparison, not an exact estimate of average dollar income or an exact percentage loss.
Some other questions match directly. Others need small, documented category changes. Where wording, answer options or eligibility differ materially, the chart still shows both available responses but the text does not describe the gap as a clean annual change. Missing information is not filled with zero.
The later consumer and creator-impact chapters use separate research. Their charts are explicitly labeled single-wave context. The report does not invent a 2025 consumer result to complete a visual pair. Full question matching, response bases, eligibility checks and exclusions are explained in the methodology.
Letter from the Editors
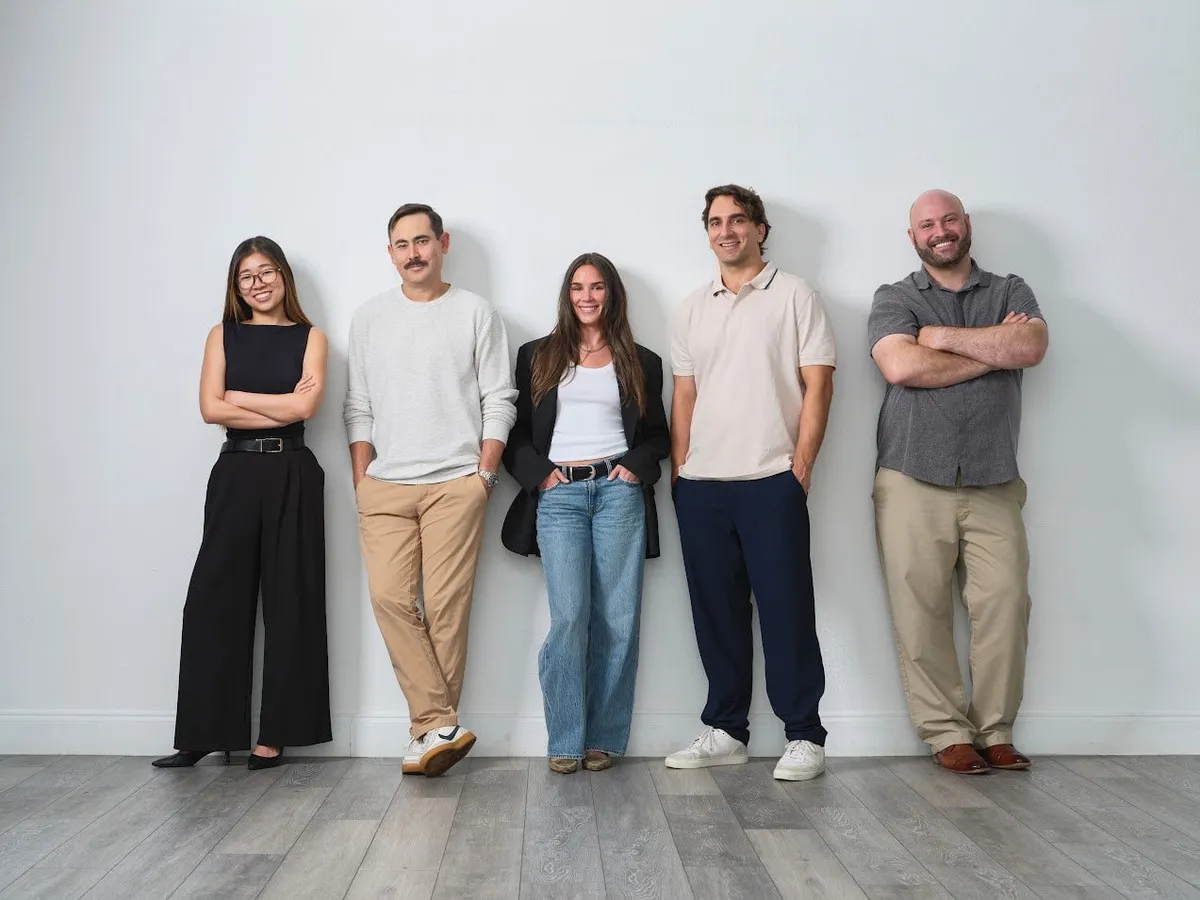
The NeoReach team
Creator earnings help explain the business behind the content. This edition examines earnings reported in our 2026 creator survey, compares matched questions with our 2025 survey and explores what the findings mean for the partnerships brands commission.
The income findings deserve attention. They also deserve care: different people answered the two waves, and some questions changed. We show the subgroup checks and the limits alongside the results so you can judge the evidence for yourself.
Creators bring audiences, judgment and production work to a campaign. Building a sustainable relationship means understanding all of those contributions. Use this report to sharpen the brief, discuss the commercial terms earlier and decide what evidence would justify the next investment.
Our aim is to help you commission better work and make a clearer case for its value.
The NeoReach editorial team
Creator economics
The lower-income-bracket pattern survives several checks. The commercial response should be a better understanding of scope, continuity and creator businesses.
The income distribution shifted toward the lowest brackets
Across the full samples, the two lowest annual creator-income brackets account for 37.0% in the 2025 wave and 50.2% in the 2026 wave. That is a 13.2 percentage-point difference, calculated before rounding. The middle $10,000-$50,000 bracket remains substantial in both waves.
- 37.0%in the two lowest income brackets, 2025 wave
- 50.2%in the two lowest income brackets, 2026 wave
- 13.2 ptsdifference, calculated before rounding
Show data
2025 | 2026 | |
|---|---|---|
$0-$5k | 25.3 | 32.8 |
$5k-$10k | 11.7 | 17.4 |
$10k-$50k | 27.3 | 29.7 |
$50k-$100k | 16.5 | 10.4 |
$100k-$500k | 14.8 | 9.3 |
$500k-$1m | 2.9 | 0.2 |
$1m+ | 1.5 | 0.2 |
The median selected bracket moves from $10,000-$50,000 to $5,000-$10,000. A bracket is all the survey can establish. It cannot tell us whether the median respondent earned $5,001 or $9,999, nor can it produce a defensible exact dollar decline from those ranges. The older instrument also shares endpoints between adjacent brackets.
For an enterprise marketer, annual creator income and a campaign fee answer different questions. A creator may have a small number of highly relevant partnerships, other sources of work, or a part-time publishing schedule. Price the production, distribution and rights you are commissioning. Use this income distribution to test assumptions about the supplier base and the sustainability of the relationship.
The shift persists within full-time and part-time groups
Among full-time respondents, the share in the two lowest brackets rises from 19.0% to 25.6%. The combined upper four brackets fall from 51.7% to 40.9%. Comparing within work status removes one obvious difference between the waves, although geography, platform, experience and recruitment can still differ.
Show data
$0-$10k bands | $10k-$50k band | $50k+ bands | |
|---|---|---|---|
2025 | 19 | 29.3 | 51.7 |
2026 | 25.6 | 33.5 | 40.9 |
A full-time designation does not tell you how much delivery capacity a creator has available for your launch. Agree the production schedule early, specify the revision allowance and ask which dependencies could delay delivery. If you need continuity over several months, put the proposed cadence and payment schedule in the first commercial discussion.
Part-time creators: income distribution
Among part-time respondents, the two lowest brackets rise from 62.7% to 68.8%. The upper four brackets fall from 13.0% to 4.5%. These are different samples, not a record of the same people losing earnings. Still, the pattern is not confined to the changing proportion of full-time creators in the headline sample.
Show data
$0-$10k bands | $10k-$50k band | $50k+ bands | |
|---|---|---|---|
2025 | 62.7 | 24.3 | 13 |
2026 | 68.8 | 26.8 | 4.5 |
Part-time does not mean casual about the work. It may mean a tighter filming window, a day job or a different revenue mix. Build enough lead time into approvals that the creator can use the production window you agreed. A late brief change has a real scheduling cost even when the content is filmed on a phone.
The direction persists within Instagram and TikTok samples
Within the Instagram-primary samples, 28.9% in the older wave and 53.3% in the newer wave select the two lowest income brackets. The bases are 90 and 306. This comparison is useful because the full sample becomes much more Instagram-heavy, but it does not hold audience size, niche or work status constant.
Show data
$0-$10k bands | $10k-$50k band | $50k+ bands | |
|---|---|---|---|
2025 | 28.9 | 21.1 | 50 |
2026 | 53.3 | 26.8 | 19.9 |
Do not convert that difference into an Instagram rate forecast. The question asks about the creator’s whole career income, not Instagram-only revenue. For campaign planning, group potential partners by the audience, content job and commercial terms relevant to your campaign. A platform label is only the start of that comparison.
TikTok-primary creators: income distribution
For TikTok-primary respondents, the same lower-bracket share rises from 41.4% to 50.4%, with bases of 181 and 129. The upper-bracket share also declines. The repeated direction makes the overall income finding worth investigating, while leaving its causes unresolved.
Show data
$0-$10k bands | $10k-$50k band | $50k+ bands | |
|---|---|---|---|
2025 | 41.4 | 29.8 | 28.7 |
2026 | 50.4 | 34.1 | 15.5 |
A useful next analysis would combine platform, work status and audience size under a stable recruitment method. We cannot complete that exercise reliably here because the older follower-count field does not establish whether it measures one channel or a combined audience. We keep that missing definition visible instead of letting an attractive segmentation chart conceal it.
Management status separates different creator businesses
Managed respondents select the upper four income brackets more often than independent respondents in both waves. Within the managed samples, that share is 61.5% in 2025 and 51.5% in 2026. The managed bases are 104 and 68, large enough to describe but too different to treat as the same group progressing over time.
Show data
2025 | 2026 | |
|---|---|---|
$0-$10k bands | 16.3 | 20.6 |
$10k-$50k band | 22.1 | 27.9 |
$50k+ bands | 61.5 | 51.5 |
This is not an estimate of the revenue created by a manager. Creators with larger commercial opportunities may be more likely to obtain representation, and agencies may select creators who already earn more. The survey does not separate those explanations. It does show why managed and independent creators should not be treated as interchangeable segments in an earnings benchmark.
Independent creators: income distribution
Among independent respondents, the two lowest brackets rise from 44.0% to 55.2%. The independent samples contain 307 and 404 respondents. The comparison reinforces the need to understand the operating capacity behind a creator account rather than judging professional readiness solely by representation.
Show data
2025 | 2026 | |
|---|---|---|
$0-$10k bands | 44 | 55.2 |
$10k-$50k band | 29 | 30 |
$50k+ bands | 27 | 14.9 |
For an independent partner, make the commercial process easy to navigate: one consolidated brief, a named decision-maker and a clear invoice route. For a managed partner, agree who owns approvals and which terms need agency clearance. Those are workflow recommendations, not claims that one arrangement produces better campaign returns.
The income pattern remains after a shared eligibility check
The older wave includes 12 respondents aged 13-17 and a mix of US, international and ambiguous location answers. As a sensitivity check, we retain respondents aged 18 or older who provide a recognized US location in each wave. That leaves 340 older responses and all 472 newer earnings responses.
Show data
$0-$10k bands | $10k-$50k band | $50k+ bands | |
|---|---|---|---|
2025 | 35 | 27.4 | 37.6 |
2026 | 50.2 | 29.7 | 20.1 |
Within this filtered comparison, the two lowest brackets account for 35.0% in 2025 and 50.2% in 2026. The direction also persists within the filtered full-time and part-time groups. Removing the clearest age and geography mismatch therefore does not reverse the income pattern.
This is a transparent text-based eligibility filter, not verified residence or a representative US sample. Unknown locations are excluded rather than guessed. The remaining groups can still differ in platform, experience and recruitment. The practical conclusion is narrower and stronger: the pattern survives this particular check, so it deserves attention without becoming a claim about every creator in the country.
Work-status mix explains part of the headline difference
A simple descriptive model helps separate one composition effect. Take the 2026 lower-bracket shares within full-time and part-time groups, then apply the 2025 proportions of those two groups. The resulting lower-bracket share is 43.4%, compared with the observed 2026 share of 50.2%.
Show data
Share in two lowest brackets | |
|---|---|
2025 observed | 37 |
2026 observed | 50.2 |
2026 at 2025 work-status mix | 43.4 |
That scenario still sits above the observed 2025 share of 37.0%. Changing work-status mix matters, but it does not remove the entire difference. The calculation is a weighted average of observed subgroup shares. It is not another survey result, a causal decomposition or a claim that the sample now represents the creator population.
This is the level of scrutiny a useful benchmark needs. Before presenting a headline delta, ask which compositional changes could create it and which checks the data can support. Your own campaign portfolio has the same issue: average costs can rise because you bought more video, larger audiences or broader usage rights, even if comparable creator fees stayed flat.
Brand deals dominate the newer detailed-response sample
Brand deals or sponsored posts are the main revenue source for 70.3% of the 434 respondents answering the detailed 2026 section. The comparable named choice appears for 48.4% of the older full sample. Both numbers are worth seeing. Their difference is not a clean measure of growing dependence on brand deals.
Show data
2025 | 2026 | |
|---|---|---|
Brand deals / sponsored posts | 48.4 | 70.3 |
Ad share revenue | 23.1 | 7.1 |
Own brand / company | 6.1 | 6.9 |
Affiliate links | 1.9 | 5.3 |
Tips | 2.2 | 1.8 |
Merchandise | 1.7 | 1.2 |
Other / mixed / unspecified | 16.5 | 7.4 |
The reason is material: all 38 retained 2026 respondents missing the detailed revenue answers report zero sponsored posts. The older survey does not offer a compatible zero-post filter because its lowest volume band combines zero with other low volumes. Older free-text revenue answers also require a residual category. We therefore show the two distributions without a growth-rate claim.
Preferred main revenue source: common named choices
Brand deals are also the preferred main revenue source for 62.8% of the older respondents and 66.1% of the newer detailed-response group. This is a preference question, not a forecast or the percentage of total revenue that creators expect brands to supply. The different eligibility bases still apply.
Show data
2025 | 2026 | |
|---|---|---|
Brand deals / sponsored posts | 62.8 | 66.1 |
Ad share revenue | 14.8 | 9 |
Own brand / company | 13.4 | 12.7 |
Affiliate links | 1 | 6.5 |
Tips | 1 | 0.9 |
Merchandise | 2.7 | 1.4 |
Courses | 0.5 | 1.6 |
Other / mixed / unspecified | 3.9 | 1.8 |
For a marketer, the useful interpretation is that sponsored work is central to many respondents’ commercial plans. Give them something concrete to evaluate: an actual production scope, a rights schedule and a route to repeat work. A vague promise of future opportunities cannot be priced with the same confidence as a contracted second activation.
Business structures require a more precise conversation
In the older wave, 44.3% report owning a business or brand. In the newer detailed-response group, 55.3% either report ownership or select the newly offered team-LLC option. The grouped display is useful for understanding how creators describe their businesses. It does not establish an 11-point increase in business formation.
- 44.3%2025: own business / brand or team LLC (no current business reported: 55.7%)
- 55.3%2026: own business / brand or team LLC (no current business reported: 44.7%)
The answer options changed, and the later detailed-response base excludes some respondents. An LLC can be the legal structure for content work rather than a separate product brand. Treating all those arrangements as identical would make the chart simpler and the conclusion less useful.
Ask the questions that affect the contract: who invoices, who owns the content, who can grant paid-use rights and whether another business creates a conflict. Do not infer those answers from follower count or a polished media kit. A short commercial intake can prevent a rights problem after the content has already performed well.
How creators work
Money-focused motivation rises within both work-status groups. Available time, success measures and production choices still need their own explanations.
The later sample reports fewer high-hour schedules
The 40-plus weekly-hours category falls from 21.2% of the older sample to 11.4% of the newer sample. At the same time, the 10-20-hour category rises from 26.8% to 37.9%. These are reported categories with shared endpoints, so we do not turn them into an exact average workweek.
Show data
2025 | 2026 | |
|---|---|---|
0-10 | 12.9 | 20.3 |
10-20 | 26.8 | 37.9 |
20-30 | 25.3 | 20.8 |
30-40 | 13.9 | 9.5 |
40+ | 21.2 | 11.4 |
The increase in part-time respondents is one plausible contributor. It is not evidence that creators have become more efficient, that AI saved a particular number of hours, or that a production task should now cost less. The survey does not measure those mechanisms.
Translate the result into a scheduling question. Before booking, establish when the creator can film, how much product experience the concept requires and how long your review takes. A narrow production window combined with an open-ended approval process is a foreseeable delivery problem. Fix the process before calling it a creator-performance issue.
Available production time varies within each work-status group
Among full-time respondents, 33.5% select 40-plus weekly hours in the older wave, compared with 26.1% in the newer wave. The 20-30-hour category rises from 23.1% to 29.6%. Work status alone therefore does not describe one uniform production schedule.
Show data
0-10 | 10-20 | 20-30 | 30-40 | 40+ | |
|---|---|---|---|---|---|
2025 | 2.9 | 20.2 | 23.1 | 20.2 | 33.5 |
2026 | 3.9 | 23.2 | 29.6 | 17.2 | 26.1 |
Scope the work in deliverables and production requirements, not an assumed number of free hours. A technically demanding demonstration, an event appearance and a simple product integration place different demands on the same creator. Ask about preparation, filming, editing and revisions separately when the assignment is complex.
Weekly content-creation hours: part-time creators
Among part-time respondents, the 10-20-hour category grows from 36.1% to 49.1%, while the 20-30-hour category falls from 28.4% to 14.1%. These are sample differences rather than tracked reductions in individual working time.
Show data
0-10 | 10-20 | 20-30 | 30-40 | 40+ | |
|---|---|---|---|---|---|
2025 | 27.2 | 36.1 | 28.4 | 4.7 | 3.6 |
2026 | 32.7 | 49.1 | 14.1 | 3.7 | 0.4 |
For recurring programs, offer a predictable cadence and consolidate feedback. If your team needs three channels and several adaptations, discuss whether one production session can support them and what extra editing is required. That is a commercial conversation about scope, not an instruction to ask for more content at the same fee.
Independent creators account for more of the newer sample
The share reporting talent management falls from 25.3% to 14.4%. The question wording becomes more explicit in 2026, referring to a talent agency or manager. The result describes these respondents; it does not establish that management businesses are contracting across the industry.
- 25.3%2025: creators with talent management (independent: 74.7%)
- 14.4%2026: creators with talent management (independent: 85.6%)
For brands, the practical issue is how much coordination the campaign assumes a representative will provide. An independent creator may handle production, negotiation and invoicing personally. If your approval process depends on an agency account team chasing every update, it may need adjustment for that partner.
Use one accountable point of contact, put deadlines in the brief and state which approval is final. Maintain the same standards for disclosure, rights and delivery regardless of representation. A lighter administrative process can reduce confusion without weakening the commercial requirements.
Money-focused answers become more common
The share selecting money as the main creator approach or motivation rises from 12.9% to 22.0%. The audience-connection choice remains substantial, at 36.5% and 34.3%. We align the older structured approach question with the newer primary-motivation question because their four substantive choices closely match.
Show data
Make the best content | Connect with the audience | Earn money from content | Build a following | |
|---|---|---|---|---|
2025 | 39.2 | 36.5 | 12.9 | 11.4 |
2026 | 31.1 | 34.3 | 22 | 12.5 |
These answers do not mean creators stopped caring about content or their communities. A single-choice question asks people to prioritize one reason. It also does not explain why the money-focused share is larger. Income pressure is a plausible interpretation, but this survey comparison does not isolate that cause.
Your response can still be concrete. Put the financial terms beside the creative opportunity. Explain how the fee changes with paid usage, exclusivity or extra edits, and do not conceal those obligations in a late-stage contract. The brief should make the opportunity understandable before the creator invests time in a proposal.
The commercial shift appears in both work-status groups
Among full-time creators, the money-focused answer rises from 13.6% to 25.6%. Audience connection remains selected by 31.0% in the newer wave, and making the best content by 35.5%. The finding points to a different distribution of priorities within the full-time samples, not a wholesale replacement of creative motives.
Show data
2025 | 2026 | |
|---|---|---|
Make the best content | 41.3 | 35.5 |
Connect with the audience | 36 | 31 |
Earn money from content | 13.6 | 25.6 |
Build a following | 9.1 | 7.9 |
A full-time partner needs to assess the opportunity as a business commitment. A paid pilot with a clear renewal decision is easier to evaluate than an indefinite promise of exposure. If you want an ongoing relationship, specify what successful delivery and performance would need to look like before the next booking.
Creator motivation: part-time creators
Among part-time creators, money-focused answers also rise, from 11.8% to 19.3%. Audience connection stays close to 37% in both waves. The similarity on connection and the difference on money can coexist; a commercial ambition does not erase the relationship that makes a recommendation credible.
Show data
2025 | 2026 | |
|---|---|---|
Make the best content | 36.1 | 27.9 |
Connect with the audience | 37.3 | 36.8 |
Earn money from content | 11.8 | 19.3 |
Build a following | 14.8 | 16 |
Let the creator explain where the product belongs in their content and what would make the partnership worthwhile. Then agree the commercial scope. If the only way to sell the opportunity is to avoid discussing the fee until the end, the proposition probably needs more work.
Income motivation rises while income as a success measure holds steady
Income is the primary personal success measure for 28.0% in each full sample after rounding. Engagement rises from 36.7% to 42.6%, while follower count falls from 13.1% to 10.6%. That creates an instructive distinction from the growing money-focused motivation share.
Show data
2025 | 2026 | |
|---|---|---|
Engagement | 36.7 | 42.6 |
Income | 28 | 28 |
Community / connection | 22.1 | 18.9 |
Follower count | 13.1 | 10.6 |
Motivation asks why a creator does the work. A success measure asks how they judge progress. A creator can want a sustainable income while using engagement to assess whether the content resonates. Treating the two questions as contradictory would lose that distinction.
At kickoff, agree both the audience response the creative should earn and the business result the campaign should support. Engagement can diagnose whether a message connects; a conversion measure can test whether an intended action follows. Keep those roles separate in the report, and explain how the team will respond if one improves while the other does not.
Shares and saves receive more attention in the later responses
Among the common named choices, shares are selected by 46.5% of older respondents and 58.1% of newer respondents. Saves are selected by 31.4% and 45.8%. Likes move from 72.5% to 61.4%. Respondents can choose several metrics, so these percentages do not form a distribution that sums to 100%.
Show data
Likes | Comments | Shares | Saves | |
|---|---|---|---|---|
2025 | 72.5 | 63 | 46.5 | 31.4 |
2026 | 61.4 | 59.1 | 58.1 | 45.8 |
The answer environment also changed. Views and watch time appear more explicitly in the later responses, which can influence how people select other choices. We present the common measures descriptively and do not claim a clean annual increase in the importance of every metric.
Use the distinction when judging creative. Saves may indicate that a tutorial deserves another look; shares may indicate that a recommendation travels between people. Neither proves a sale. Match the signal to the creative’s job, then connect it to an appropriate downstream measure rather than promoting every positive engagement into a commercial outcome.
Video-heavy output remains common in both waves
After combining the newer 100%-video response with its 75-100% category, the broad top band contains 65.7% of the older sample and 59.7% of the newer one. The display preserves reported ranges rather than pretending the survey counted every asset a creator published.
Show data
0-25% video | 25-50% video | 50-75% video | 75-100% video | |
|---|---|---|---|---|
2025 | 9.5 | 7.8 | 17 | 65.7 |
2026 | 9.1 | 13.1 | 18 | 59.7 |
That comparison supports a straightforward planning assumption: many respondents organize their work heavily around video. It does not tell you whether short video outperforms long video for your product, or whether one platform deserves more budget. Those require compatible creative and performance evidence.
Write the production brief around the explanation the viewer needs. A demonstration may require a real use sequence, a close-up and an objection addressed in plain language. Agree which adaptations are needed for other placements and price those edits explicitly. Calling everything a short-form asset does not make the production job identical.
More respondents fall into the longer-experience group
The harmonized category covering three or more years of creator experience contains 73.5% of the older sample and 80.1% of the newer one. We combine the upper categories because the instruments split the four- and five-year boundary differently.
Show data
Less than 1 year | 1-2 years | 3 years or more | |
|---|---|---|---|
2025 | 4.9 | 21.7 | 73.5 |
2026 | 4.7 | 15.3 | 80.1 |
Experience can change the questions a creator asks about a campaign, but the survey does not establish an experience premium or a causal relationship with results. The newer sample’s age and platform profile also differ. An apparent increase in tenure is a profile finding, not proof that new entrants have disappeared.
In selection, ask for relevant examples and evidence of reliable delivery. An experienced creator in an unrelated category may need more product education than a newer creator with strong subject knowledge. Use a paid pilot to test that fit when the brief requires specialist understanding, and evaluate the pilot against the actual audience decision you need to influence.
Career paths and profiles
Education, experience and demographic composition help explain who answered. They should inform the reading of the results without becoming stereotypes for casting.
Higher-education attendance is more common in the newer responses
The older survey records higher-education attendance for 77.9% of respondents. Combining Yes and the newly added Some option gives 88.1% in the newer wave. That broader answer option is a reason to qualify the comparison, not a detail to hide below a dramatic headline.
- 77.9%2025: any higher education (no higher education: 22.1%)
- 88.1%2026: any higher education, Yes plus Some (no higher education: 11.9%)
For follow-up questions, we compare respondents who selected Yes in both instruments and answered the relevant item. That excludes the new Some group from the later follow-up comparisons. It narrows a routing mismatch, although the changed attendance option can still affect who chose Yes.
The practical relevance for a brand is skills and subject knowledge, not a degree requirement. A creator’s education can be useful context for a technical product or regulated claim, but it does not replace checking the content’s accuracy and the boundaries of their expertise. Ask what they can credibly explain and what needs specialist review.
The degree-relevance distribution is broadly similar
Among the aligned Yes-attendance follow-up groups, 35.6% in the older wave and 34.5% in the newer one select the lowest relevance rating. The top rating is selected by 17.3% and 16.7%. The broader distribution is more stable than the headline attendance shares might suggest.
Show data
2025 | 2026 | |
|---|---|---|
1 | 35.6 | 34.5 |
2 | 12.7 | 12.1 |
3 | 19.6 | 20.3 |
4 | 14.7 | 16.4 |
5 | 17.3 | 16.7 |
This is a five-point response scale, not a percentage of skills acquired through education. It asks how respondents assess the relevance of their degree to content creation. A low rating does not mean the degree had no value outside that work or that formal training cannot matter for particular categories.
When vetting a creator for a specialist brief, review the explanation they can deliver. Ask for a relevant sample, give access to a product expert and agree where claims need verification. The audience ultimately encounters the content, so credentials and production quality should inform the review without substituting for it.
Past education decisions should not be read as annual dropout rates
In the Yes-attendance follow-up groups, 16.1% of older respondents and 6.0% of newer respondents say they dropped out or postponed higher education to pursue content creation. The comparison concerns recalled decisions at any earlier point, not events occurring during 2025 or 2026.
- 16.1%2025: postponed or left higher education for content creation (No: 83.9%)
- 6.0%2026: postponed or left higher education for content creation (No: 94.0%)
The newer sample is older and has a different platform mix, while the attendance options also changed. Those differences can affect the distribution of educational histories. The chart is included because the question closely recurs, but it cannot support a headline claiming that the creator economy reduced annual dropout rates.
For partnerships, avoid projecting one career story onto every creator. Some combine education, employment and content for years. Ask about availability and conflicts that affect the assignment. A workable production calendar depends more on those current commitments than on a generalized story about creators leaving education to become full-time influencers.
Creator work is one of several ways respondents funded education
Among common named funding choices, being a creator is selected by 21.2% of the older Yes-attendance group and 9.9% of the newer one. Family support and student loans remain substantial in both groups. Multiple selections are allowed, and the later questionnaire expands other options.
Show data
2025 | 2026 | |
|---|---|---|
Being a creator | 21.2 | 9.9 |
Supported by family | 44.1 | 38.1 |
Student loans | 35 | 37 |
Work-study | 15.4 | 9 |
These are recalled sources used to finance education, not a current debt balance or an annual measure of financial independence. The changed response options and eligibility mean the paired results should be read as descriptive evidence. They do not establish that creators became less able to fund study.
The broader commercial lesson is to avoid inferring financial circumstances from a creator’s public image. Negotiate the work on its scope and expected value. Clear deposits, reimbursement rules and payment dates can remove uncertainty without requiring a creator to disclose personal finances to justify ordinary commercial terms.
The adult sample becomes older
Among adults, the 18-24 group accounts for 34.1% of the older wave and 19.1% of the newer wave. The 35-44 group accounts for 11.5% and 21.8%. Twelve older respondents aged 13-17 are excluded from this chart; they remain in full-wave charts where noted.
Show data
18-24 | 25-34 | 35-44 | 45+ | |
|---|---|---|---|---|
2025 | 34.1 | 51.9 | 11.5 | 2.5 |
2026 | 19.1 | 53.8 | 21.8 | 5.3 |
This profile belongs beside the interpretation of earnings, work patterns and education. Older respondents may have different employment and educational histories, but the survey does not isolate age as the cause of any income difference. It also does not estimate the age distribution of all creators.
For audience planning, creator age is not a substitute for audience age. Confirm the audience composition relevant to your product and market. For the research, keep the two concepts separate: this chart describes the people who answered the creator survey, not the consumers reached by their content.
Gender composition differs between the survey samples
Cisgender women represent 42.8% of the older responses and 60.0% of the newer responses to the gender-identity question. Cisgender men represent 43.1% and 28.6%. Respondents can select more than one identity, so the displayed shares can exceed 100% when added.
Show data
2025 | 2026 | |
|---|---|---|
Cisgender woman | 42.8 | 60 |
Cisgender man | 43.1 | 28.6 |
Other gender identities | 3.9 | 3 |
Prefer not to disclose | 12.2 | 8.9 |
This is another reason to avoid presenting the two samples as interchangeable. Smaller identity categories are combined in the display, and that grouping is a limitation rather than evidence that those experiences are uniform. The survey comparison does not establish a market-wide shift in who becomes a creator.
For a campaign roster, define the relevance and representation the audience and brief require, then assess selection against those goals. Do not let the composition of a convenience sample become the default casting template. For reporting, explain whose answers the benchmark contains before using it to describe an entire industry.
What makes partnerships work
Separate 2026 research connects creator economics to the work audiences find useful and the conditions creators value. These findings provide context, not a manufactured annual comparison.

Creator influence reaches beyond the checkout
Show data
Share of respondents | |
|---|---|
None of the above | 45.1 |
Try a new restaurant/food | 30.8 |
Purchase a product | 29.4 |
Try a new routine (fitness, skincare, productivity, etc.) | 19.2 |
Book a travel experience | 15.4 |
Attend an event | 13.6 |
Other | 2.5 |
A creator campaign can change a buying decision before it produces a trackable order. In the January 2026 consumer survey, 30.8% say online creators have influenced them to try a restaurant or food, 29.4% to purchase a product, and 19.2% to try a new routine. Travel bookings and event attendance also appear. These are different commercial actions, with different routes from recommendation to revenue. A restaurant visit should not disappear from the assessment because the campaign team happens to have an affiliate dashboard.
48.7% report no monthly purchases based on creator suggestions
Show data
Share of respondents | |
|---|---|
None | 48.7 |
1-2 items | 25.8 |
3-5 items | 14.1 |
6-10 items | 3.7 |
10+ items | 1.1 |
Don't know | 6.6 |
The same study also limits the story. Some 45.1% select none of the listed creator-influenced actions. In a separate question about monthly purchases, 48.7% report buying no items based on creator suggestions, while 25.8% select one or two and 14.1% select three to five. These questions measure different things: one asks about influence on listed activities, the other about monthly buying frequency. They cannot be combined into a single conversion funnel. All percentages use the full sample of 1,050 US internet users aged 18-64, including people who do not buy on creator recommendations.
For your next brief, specify the consumer action before choosing the success metric. A trial-focused food campaign might examine qualified store visits or offer redemption. A product launch might track product research, new-customer purchases and subsequent repeat buying separately. Use reported consumer behavior to identify plausible campaign jobs, then measure your actual campaign against those jobs. The survey does not establish an attributed conversion rate, an incremental sales effect or a guaranteed audience response. You still need the destination, the offer and the measurement to work. A persuasive recommendation cannot repair a checkout that has other plans.
Make the route from recommendation to product easy to follow
Show data
Share of respondents | |
|---|---|
Amazon Storefront | 16.8 |
Instagram feed posts | 24 |
Instagram Stories | 25.2 |
Linktree or bio links | 7 |
LTK (LikeToKnow.it) | 5.3 |
TikTok Stories/Now | 16.7 |
TikTok videos | 28.2 |
YouTube video descriptions | 31.3 |
Other | 4.1 |
None of the above | 31.5 |
The place a consumer encounters a recommendation and the place they find the product are part of the same buying experience. YouTube video descriptions are selected by 31.3% of consumers when asked where they usually find products recommended by creators. TikTok videos receive 28.2%, Instagram Stories 25.2%, and Instagram feed posts 24.0%. Amazon Storefronts receive 16.8%. These are selections from the full January 2026 sample, with multiple answers allowed; they are not market shares or conversion rates for each placement.
The useful distinction is between publishing content and making its recommendation actionable. A description can carry a specific product link, while a Story can connect an explanation with a destination. The survey does not tell us which route converted best, and 31.5% select none of the listed locations. It does show that a creator brief which specifies the video but leaves the product destination vague is missing a material part of the execution. The audience should not need to decode three similar product names after the creator has finished explaining one of them.
Make destination checks part of creative approval. Confirm the product variant, stock, mobile experience and offer terms. Agree who updates links when availability changes. Separate clicks from purchases in reporting: strong traffic with weak checkout completion calls for a review of product information, price and friction. Assign that responsibility before the first post.
Everyday context and Stories lead creators’ responses
Show data
Share of creators | |
|---|---|
Authentic day-in-the-life content | 56.1 |
Story-driven content | 44.4 |
Trend-based content | 42.3 |
Tutorials/how-to videos | 37 |
Product reviews | 36.3 |
Before-and-after transformations | 28.3 |
High-production content | 24 |
Other | 9 |
In NeoReach's 2026 impact survey, 56.1% of creators choose authentic day-in-the-life content among the formats that produce their strongest results. Story-driven content follows at 44.4%, trend-based content at 42.3%, tutorials at 37.0%, and product reviews at 36.3%. High-production content is selected by 24.0%. The respondents define their own strongest results, so this is a view of creator experience rather than a controlled ranking of sales performance. A lower selection rate does not establish that a format is ineffective.
Stories lead creators’ choices for building audience trust
Show data
Share of creators | |
|---|---|
Stories | 61.8 |
Unfiltered short-form | 59.8 |
Behind-the-scenes content | 29.8 |
Long-form reviews | 20.3 |
Livestreams | 12.1 |
Other | 9 |
A separate trust question gives Stories 61.8% and unfiltered short-form content 59.8%, ahead of behind-the-scenes content at 29.8% and long-form reviews at 20.3%. Both questions allow multiple answers from 487 retained creators. Read together, they make a practical case for testing product explanation inside a creator's familiar content style. They do not justify replacing every considered review with a casual clip. A complex product may need time to demonstrate setup, explain tradeoffs or answer an objection that a shorter format cannot accommodate.
Brief the proof you need and leave room for the creator to make it believable. For a skincare launch, for example, you could ask the creator to show where the product fits in a routine, what it feels like to use and which claims they can substantiate. That is an illustrative brief, not a documented campaign result. Compare executions against the relevant outcome: qualified product research, consideration or purchase, alongside content engagement. The creative test should tell you which explanation helped this audience make this decision. Counting the number of camera angles will not answer that question.
Give the next post a new reason to pay attention
Show data
Share of respondents | |
|---|---|
1 time | 11.5 |
2-3 times | 30.8 |
4-6 times | 14.3 |
7+ times | 6.6 |
Don't know | 36.9 |
Two to three exposures is the most frequently specified buying threshold in the consumer frequency question, selected by 30.8%. One exposure receives 11.5%, four to six receives 14.3%, and seven or more receives 6.6%. But the largest individual response is 'don't know', at 36.9%. That uncertainty matters. It would be convenient if the survey handed every media planner a universal frequency target. It does not. The question concerns recalled exposure to a sponsored post or advertisement, not measured impressions from a specific creator campaign.
How soon do consumers buy after a creator recommendation?
Show data
Share of respondents | |
|---|---|
Immediately | 7.7 |
Within a day | 13.9 |
Within a week | 23 |
Longer than a week | 13.8 |
Don't know | 11.2 |
I would not buy from a creator's recommendation | 30.3 |
Purchase timing adds another reason to avoid judging every activation on launch day. In the separate timing question, 23.0% say they usually buy within a week after a creator recommendation, 13.9% within a day, 13.8% after longer than a week, and 7.7% immediately. Another 30.3% say they would not buy from a creator's recommendation. These percentages cover all 1,050 respondents. They are not a distribution restricted to purchasers, and they do not establish the attribution window that will be correct for your product.
Build a sequence in which each exposure has a useful job. An introduction can establish the use case; a demonstration can address uncertainty; a follow-up can answer a real audience question or explain the offer. Reposting the same claim three times is a publishing schedule, but it gives the consumer little additional evidence. Where measurement permits, examine delivered frequency, audience overlap and time to purchase rather than equating three published posts with three exposures per person. Compare the sequence with a suitable baseline and allow for your purchase cycle. These are recommendations for testing; the survey does not prove that the proposed sequence increases sales.
Pay and product fit shape the partnership
Show data
Share rating 4 or 5 | |
|---|---|
Pay rate | 87.7 |
Brand alignment | 84.8 |
Creative freedom | 64.1 |
Timeline/effort required | 54 |
Exclusivity terms | 41.7 |
Past experience with the brand | 50.7 |
Pay rate and brand alignment sit close together in creators' deal decisions. In NeoReach's impact survey, 87.7% rate pay 4 or 5 for importance when accepting a deal; 84.8% give brand alignment the same high ratings. Creative freedom receives 64.1%, and the timeline or effort required receives 54.0%. Each factor is rated separately by 487 creators. These are importance ratings, not a share of deals won, a ranking of negotiation concessions or a prediction of how any individual creator will respond.
Why creators decline brand deals
Show data
Share rating 4 or 5 | |
|---|---|
Poor brand alignment | 77 |
Low rates | 75.4 |
Product quality concerns | 69.4 |
Bad past experiences | 68 |
Restrictive creative briefs | 47.8 |
Tight deadlines | 25.5 |
The rejection question sharpens the point. Poor brand alignment receives high likelihood-to-decline ratings from 77.0%, low rates from 75.4%, product-quality concerns from 69.4%, and bad past experiences from 68.0%. Restrictive briefs receive 47.8%. The findings support a selection process that examines whether the creator can make a credible recommendation before the team becomes attached to a follower count. An offer can be financially attractive and still ask the creator to say something their audience has little reason to believe.
Build the outreach around a specific fit hypothesis. Identify the audience need, the relevant content the creator already makes and the product experience they would need before recommending it. Give them a route to raise concerns while the idea is still adjustable. During negotiation, separate the fee from the scope, exclusivity and approval conditions so both sides can see what is being agreed. For the marketer, the useful outcome is a workable recommendation with clear obligations. A signed contract that leaves the central product claim unresolved is simply an expensive place to start a creative discussion.
Scope the work before comparing creator fees
Time and effort feature in rate-setting for 76.6% of creators in the impact survey. Follower count is selected by 51.1%, engagement by 46.8%, past brand benchmarks by 30.0%, and market demand by 29.6%. Respondents can select several methods. The result should make a rate discussion more specific: a quote contains assumptions about work, even when the spreadsheet gives the team only a creator name and a price.
Show data
Share of creators | |
|---|---|
Flat rate based on time/effort | 76.6 |
Based on follower count | 51.1 |
Based on engagement | 46.8 |
Based on past brand benchmarks | 30 |
Based on market demand | 29.6 |
Other | 7.8 |
Consider two proposals for what appears to be the same deliverable. One might cover a creator-filmed video with one agreed revision; another might include a location shoot, multiple edits, paid usage and a restricted category for several months. That is an illustrative comparison, but it explains why annual-income data and rate-setting preferences cannot produce a reliable price for 'one Reel'. The survey does not contain a normalized transaction dataset identifying equivalent work, rights and prices. The highest fee a creator has ever received would not solve that problem either.
Use a consistent scope sheet when requesting proposals. State asset count and duration, production expectations, revision limits, publication obligations, usage channels and period, exclusivity, and any amplification permissions. Ask creators to separate additional rights or deliverables where possible. Your team can then compare the cost of equivalent work and decide whether a higher fee purchases something the campaign needs. Keep a record of what changed during negotiation and which scope assumptions created extra work. Over time, your own comparable contracts can support a more useful fee benchmark than an unsupported market-average number. The immediate benefit is simpler: fewer negotiations in which both sides are pricing a different job.
Clear briefs and reliable communication make repeat work easier
Show data
Share of creators | |
|---|---|
Higher pay | 82.1 |
Creative freedom | 73.7 |
Clear expectations and briefs | 72.9 |
Access to product early | 45.6 |
Usage fees separated from deliverables | 39.8 |
Longer timelines | 31.2 |
Performance insights/analytics | 24.2 |
Other | 1.6 |
Creators ask for both creative freedom and clear direction. In the 2026 survey, 73.7% say creative freedom would help them make better-performing content, while 72.9% select clear expectations and briefs. Higher pay leads at 82.1%, and 45.6% ask for earlier product access. There is no contradiction in wanting a clear brief and room to execute it. The brand can define the audience, product facts, required disclosures and intended action while the creator decides how to make that material work for their audience.
What makes creators want to work with a brand again?
Show data
Share of creators | |
|---|---|
Smooth communication | 91.2 |
Fast payments | 81.5 |
Positive relationship with the brand | 80.5 |
Creative flexibility | 73.1 |
Strong audience engagement | 45.8 |
Clear results | 43.3 |
Other | 3.3 |
The repeat-partnership question shows how much the working relationship matters to these respondents. Smooth communication is selected by 91.2%, fast payments by 81.5%, a positive relationship with the brand by 80.5%, and creative flexibility by 73.1%. Strong audience engagement receives 45.8% and clear results 43.3%. These are creators' stated reasons to work together again, not measured retention drivers. They should not be read as permission for brands to ignore performance. They explain why good results alone may not make a difficult working process attractive.
Put the operational commitments in the campaign plan: one owner for consolidated feedback, clear approval dates, a defined revision allowance and an agreed payment schedule. Give the product enough lead time for actual use where the brief depends on firsthand experience. At the end, share the results you can substantiate and explain the next decision. A renewal conversation is more useful when the creator knows which audience response mattered and what the next activation should improve. Track approval delays, scope changes, payment timing and willingness to renew alongside commercial outcomes. These measures give your team a way to investigate partnership friction instead of discovering it when the next outreach goes unanswered.
Income instability belongs in partnership planning
Show data
Share of creators | |
|---|---|
Inconsistent income | 41.7 |
Algorithm changes | 18.9 |
Burnout | 16.4 |
Pressure to create constantly | 14.8 |
Negotiating contracts | 4.3 |
Brand communication | 2.1 |
Other | 1.8 |
The annual-income comparisons earlier in this report describe how earnings are distributed across the two creator samples. They do not show how predictable that income feels. The separate 2026 impact survey addresses that pressure directly: 41.7% choose inconsistent income as the hardest part of being an influencer. Algorithm changes receive 18.9%, burnout 16.4%, and pressure to create constantly 14.8%. This question asks each of 487 respondents to choose one challenge, so its percentages describe a primary difficulty rather than the prevalence of every problem.
An annual total can hide a difficult working rhythm. A creator may have an acceptable yearly income while still facing uncertainty about the next booking, late approvals or the timing of payment. That is a plausible interpretation of why stability deserves attention, not a finding about the cash flow of specific respondents. We also cannot infer that this pressure increased since 2025: the older creator-challenge question differs from this impact-survey instrument. The finding belongs here as current context for the economics, not as another annual change claim.
Where repeat work suits the campaign, discuss a realistic planning horizon, defined deliverables and a predictable payment schedule. A longer relationship still needs review points and evidence that the creator remains relevant to the audience. If a retainer is inappropriate, you can be precise about booking decisions and avoid implying future work that has not been approved. Give creators early notice when plans change and settle completed work according to the agreed terms. These are controllable parts of the brand's process. The survey does not establish a return from any particular contract structure, but it identifies a pressure that a professional partnership should take seriously.
Consumers still need a clear offer and useful product information
Show data
Share of respondents | |
|---|---|
Offering discounts or promotions | 45.1 |
Providing clear product information and reviews | 34.7 |
Posting authentic, relatable content | 28.8 |
Supporting causes or values I believe in | 22.2 |
Sharing customer testimonials or success stories | 21.4 |
Limited-time product drops or exclusives | 18.3 |
Consistently posting new content | 15.5 |
Partnering with creators I trust | 16.4 |
Engaging with followers in comments or messages | 15.1 |
None of the above | 16.7 |
A trusted creator can explain an offer; the offer still has to make sense. In the January 2026 consumer study, 45.1% select discounts or promotions among the brand behaviors that make them more likely to buy. Clear product information and reviews receive 34.7%, authentic and relatable content 28.8%, support for causes or values they believe in 22.2%, and customer testimonials or success stories 21.4%. Partnering with creators they trust is selected by 16.4%. Multiple answers are allowed from the full sample of 1,050 US internet users aged 18-64.
These are stated purchase influences, not incremental sales effects. Several can work together. When a campaign attracts interest without purchases, review whether people understand the product, believe its claims and value the offer. A more enthusiastic opening line may leave the real buying objection untouched.
Bring the creator lead, ecommerce team and product owner into the brief. Identify the objections to answer, claims to demonstrate and offer details to keep accurate. Check margin and stock before adding a promotion. Then test the combination. Your team owns the product promise and the experience after the click.
The next campaign
Translate the evidence into a clearer scope, a workable commercial relationship and a measurement plan that can withstand a serious budget conversation.
Make creator economics part of the booking process
Start with the consumer decision the campaign needs to influence. Then specify the creator’s job: introduce a product, explain a difficult feature, resolve an objection or support an informed purchase. This prevents the commercial discussion from becoming a negotiation over a generic post whose purpose keeps changing.
Build a scope sheet that separates production from distribution and rights. Record the assets, formats, revision allowance, posting dates, exclusivity and paid-use period. Ask which terms materially change the creator’s fee. The report’s income findings make sustainable terms worth examining, but they do not supply a universal rate card.
Offer a defined next step for promising partners. A paid pilot can establish product fit, delivery reliability and audience response. Decide in advance which evidence would justify renewal and when the creator will hear that decision. If there is no committed next budget, say so rather than presenting speculative repeat work as compensation for a lower current fee.
For ongoing programs, monitor both campaign outcomes and operating friction. Track approval turnaround, revisions beyond scope, invoice timeliness and creator retention alongside the audience and commercial measures. Those operating metrics can reveal problems your reach dashboard will never diagnose. Any claim that fixing them improves performance should then be tested against your own program data.
Build a comparison your finance team can interrogate
Choose the comparison unit before calculating a change. A creator fee, a total production budget and a cost per incremental customer are different measures. Match the deliverable, audience, usage rights, paid support and time period before presenting a percentage movement. Otherwise, the mix of work can change while the underlying price of comparable work does not.
Use attention and engagement to diagnose creative response. Use product-page behavior and consideration research to examine evaluation. Use purchases to describe commercial outcomes. When claiming incremental contribution, add an appropriate comparison or lift design rather than treating affiliate attribution as a complete counterfactual.
Report the denominator beside every result. A creator answering a detailed earnings question is not automatically equivalent to every retained survey respondent. A customer who used an affiliate code is not the same as every exposed consumer. Missing responses, different eligibility and changing channel mix are part of the explanation, not housekeeping to remove before the executive presentation.
Finally, keep a record of what would change the conclusion. For this report, a stable recruitment frame and matched consumer questions would materially strengthen a future annual edition. For your campaign, the missing evidence might be a control group, better rights-cost accounting or a longer conversion window. Name it, then make collecting it part of the next brief.
Research populations and retained responses
NeoReach’s 2025 creator wave contains 417 timestamped submissions, collected from December 16, 2024 to April 2, 2025. Retaining the latest timestamp per trimmed, case-normalized email yields 411 responses. Of those retained records, 90 were submitted in December 2024 and 321 in 2025. The wave label is retained for continuity; the fieldwork window is disclosed throughout the report.
The 2026 Creator Earnings Survey contains 516 submissions from May 14 to November 8, 2026. The same deduplication rule yields 472 retained responses. Detailed earnings, revenue and business questions generally have 434 answers. All 38 respondents missing that section report zero sponsored posts. We use item-specific bases and do not turn skipped answers into zero income.
Sixteen normalized email keys occur in both comparison waves. Email matching is not verified identity resolution. The principal analysis uses the full retained responses within each wave rather than treating that small overlap as a representative longitudinal panel. The supplied workbooks do not establish a probability-sampling frame, response rate or population weighting scheme.
The separate Creator Impact Survey contains 539 submissions from January 21 to March 3, 2026 and 487 retained responses under the same rule. It contributes partnership and creator-impact context, not a second earnings wave. Across the two 2026 creator studies, 106 normalized email keys overlap. Counts from separate studies must not be added and described as distinct creators.
The consumer charts selected for this edition use Statista Consumer Insights Pulse research collected January 13-20, 2026 among 1,050 US internet users aged 18-64. The supplied export also contains distinct 2025 consumer research, but no matching influencer-outcome question repeated across the two years. We do not treat different consumer questions as an annual series.
How the questions were matched
Direct comparisons retain the original full-/part-time categories, weekly-hour bands, management status and common primary-platform choices. Four success-measure categories are aligned after normalizing the community/connection label. Gender identity remains multiple-select. The adult age display removes the 12 older-wave respondents aged 13-17 and combines the older age groups into 45-plus.
The motivation comparison uses the older structured creator-approach question, not its open-ended inspiration question. Its four substantive answers closely match the later primary-motivation choices. Experience is grouped into less than one year, one to two years, and the combined three-years-or-more categories. The newer 100%-video category is combined with the broader 75-100% video band.
Annual-income responses in the later instrument are aggregated into the seven broad older bands. The older labels share endpoints, while the later labels generally separate them. All income results therefore concern reported response brackets. No midpoint-based mean, exact dollar median or precisely bounded income threshold is inferred. Broad labels such as $0-$10k bands refer to the grouped choices, not verified individual dollar amounts.
Higher-education attendance compares older Yes responses with newer Yes plus Some responses. Follow-up comparisons instead restrict both waves to Yes-attendance respondents who answered the item. The newer Some group is excluded from those follow-ups. Financing compares only common named choices; it does not pretend expanded response options are identical.
Current and preferred main revenue sources use common explicitly named choices, with other, mixed and unspecified answers retained in a residual category. Business ownership combines newer Yes and team-LLC answers and groups older thinking-about-starting with No. These displays are paired descriptions with changed options or eligibility. No clean growth-rate claim is attached to them.
What the sensitivity checks establish
Income is compared within work-status, primary-platform and management groups using each group’s own denominator. These are overlapping analytical cuts, not mutually exclusive pieces of one total. They reduce specific composition differences but do not simultaneously control every variable. The observed patterns remain associations in self-reported samples.
The common-population sensitivity retains respondents aged 18 or older with a recognized US state, territory, district or clearly mappable US location response. Ambiguous, missing and non-US older responses are excluded rather than assigned a residence. This leaves 340 older and 472 newer respondents. The filter is based on self-report and text classification, not external residence verification.
The work-status standardization applies the newer within-status lower-income-band shares to the older full-/part-time proportions. In symbols, it is the older full-time share multiplied by the newer full-time lower-band share, plus the older part-time share multiplied by the newer part-time lower-band share. The result is 43.4%. It is a descriptive scenario, not a third sample or a population-weighted estimate.
Percentages are calculated from counts before rounding to one decimal. Percentage-point differences are also calculated before rounding, so subtracting the printed values can occasionally differ by 0.1 point. Multi-select shares can exceed 100%. Exclusive distributions can total 99.9% or 100.1% after rounding. No significance test is used to imply representativeness that the recruitment information does not establish.
Questions that do not support an annual change claim
Platform-specific earnings are excluded from the paired growth analysis. The older instrument asks for 2024 earnings through open text and does not consistently separate brand deals from native platform programs. The later instrument asks about the previous 12 months in separate income brackets. Sponsored-post volume has the same period mismatch and changes its lowest category from a combined zero-to-ten band to a separate zero option.
Follower-tier comparisons are withheld because the older added Follower Count field does not document whether it represents a primary channel or combined channels. The later survey explicitly asks for combined following. Niche selections also change from unrestricted choose-all to a maximum of three. Those differences prevent clean percentage changes without additional instrument information.
Creator challenges change substantially in response format, and the highest single sponsorship payment is a lifetime maximum reported in varied free text. Neither is presented as an annual rate or challenge-frequency trend. Consumer purchase and partnership-attitude charts have no compatible older baseline in the supplied material and remain clearly labeled context.
The report’s recommendations are NeoReach’s interpretation of the evidence, not measured effects of a particular intervention. The cover portrait and team photograph were supplied by NeoReach. The product-demonstration and creator-partnership photographs are AI-generated editorial illustrations; they do not depict respondents or documented campaigns. Previous editions and all raw workbooks remain intact.
Make the next partnership more valuable
Use the earnings findings to ask better questions about the creators you book, the work you commission and the evidence you accept.
Then make those answers visible in the next brief, the next contract and the next performance review.