


James Michalak
Chief Executive Officer
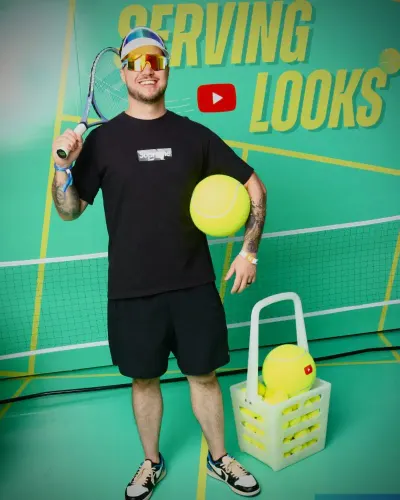
From trends to TikTok Shop, we run end-to-end TikTok creator programs — turning native, scroll-stopping content into views, demand and conversions.
View our work on TikTokSpeak to an expert

TikTok's global audience — where culture starts and products go viral.
Trust a brand more after seeing it from a TikTok creator.
Discover new products directly on TikTok.
Creator content drives roughly 2× the engagement of brand-only posts.
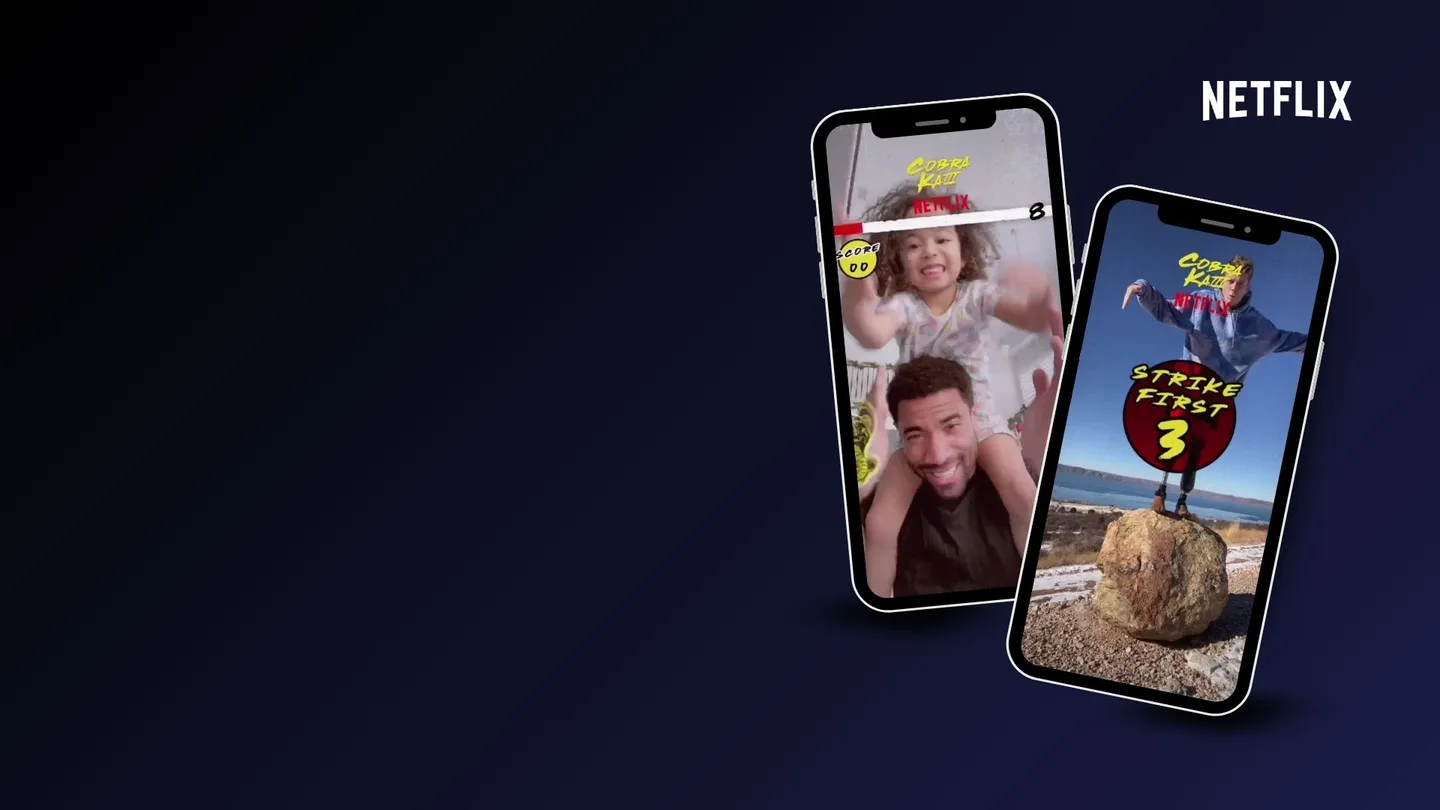
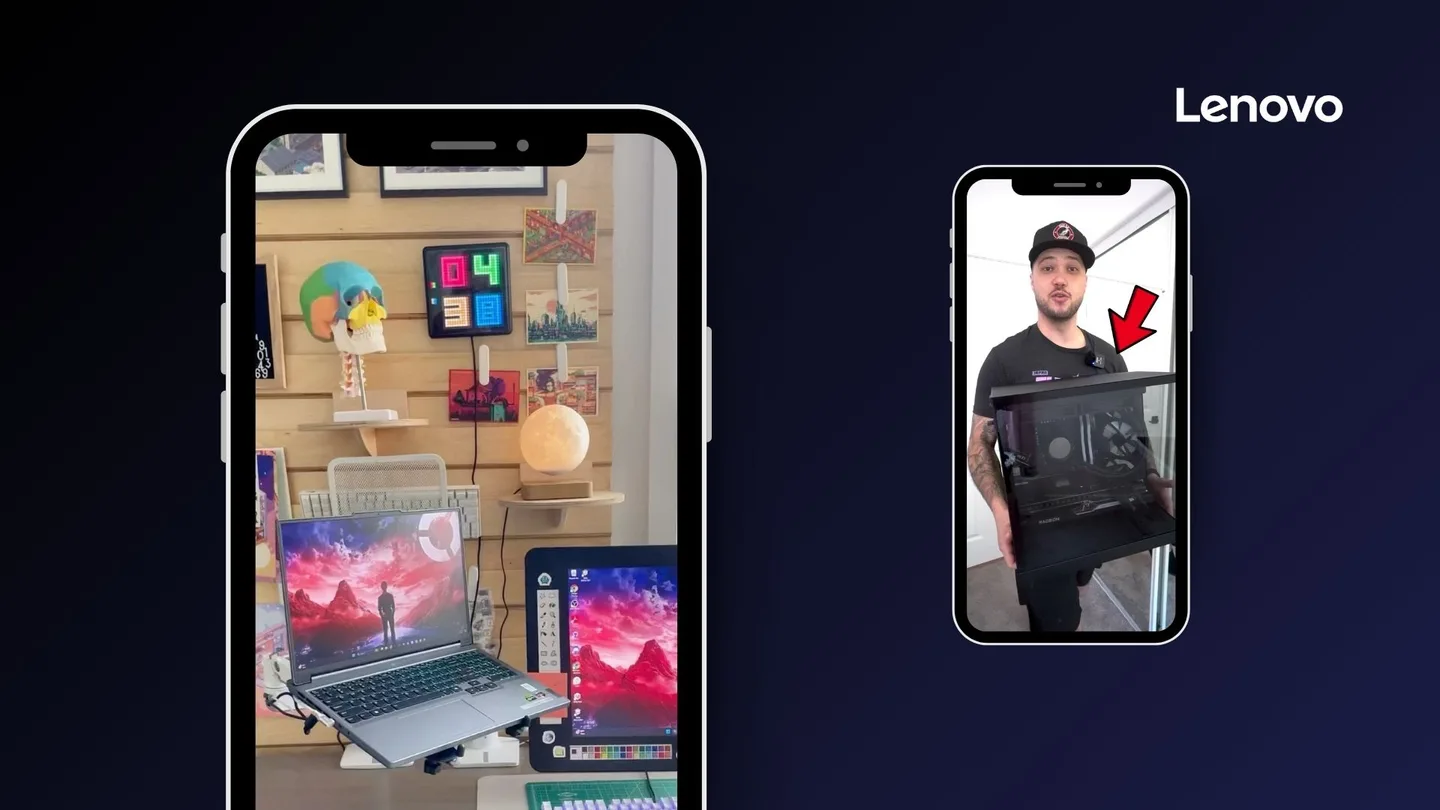
Everything we’ve claimed on this page, we’ve already done for the brands you’d expect to be hardest to impress. We put NVIDIA in front of 48 million people. We drove 4.6 billion views for Netflix.
All case studiesPaid Social
UGC Production
UGC Production
UGC Production
Full Service Influencer Marketing
Social Media Management
Full Service Influencer Marketing
Paid Social
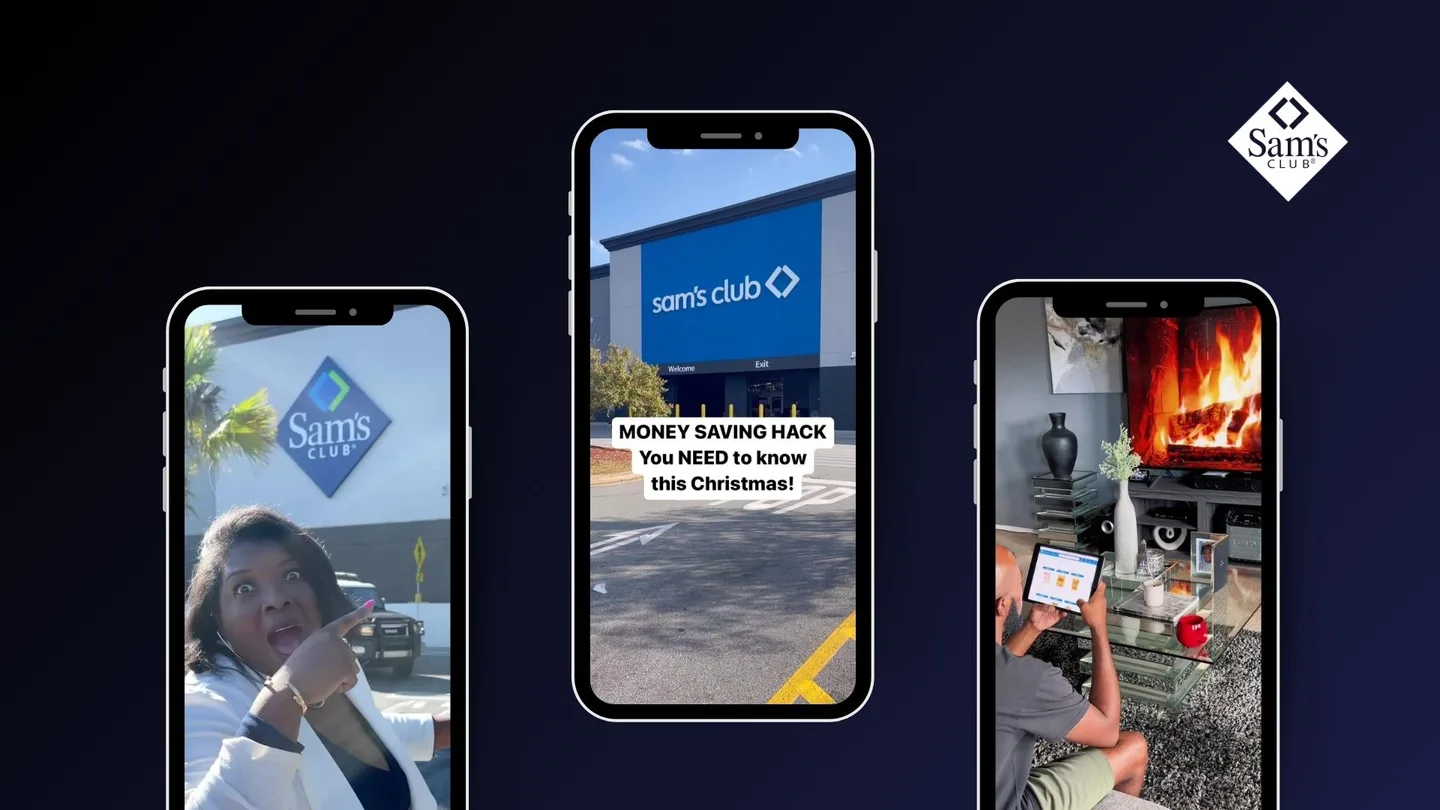
The most common reason brand content fails on TikTok is that it communicates brand pillars instead of fitting a native format. We start from the TikTok-native idea: the moment a viewer realises a product solves a recurring problem, a visible before-and-after, a demonstration, a comparison, or an honest review. The brand message is built inside that structure rather than imposed on it. Concepts that cannot be expressed in a recognisable TikTok format are reworked before any creator is briefed.
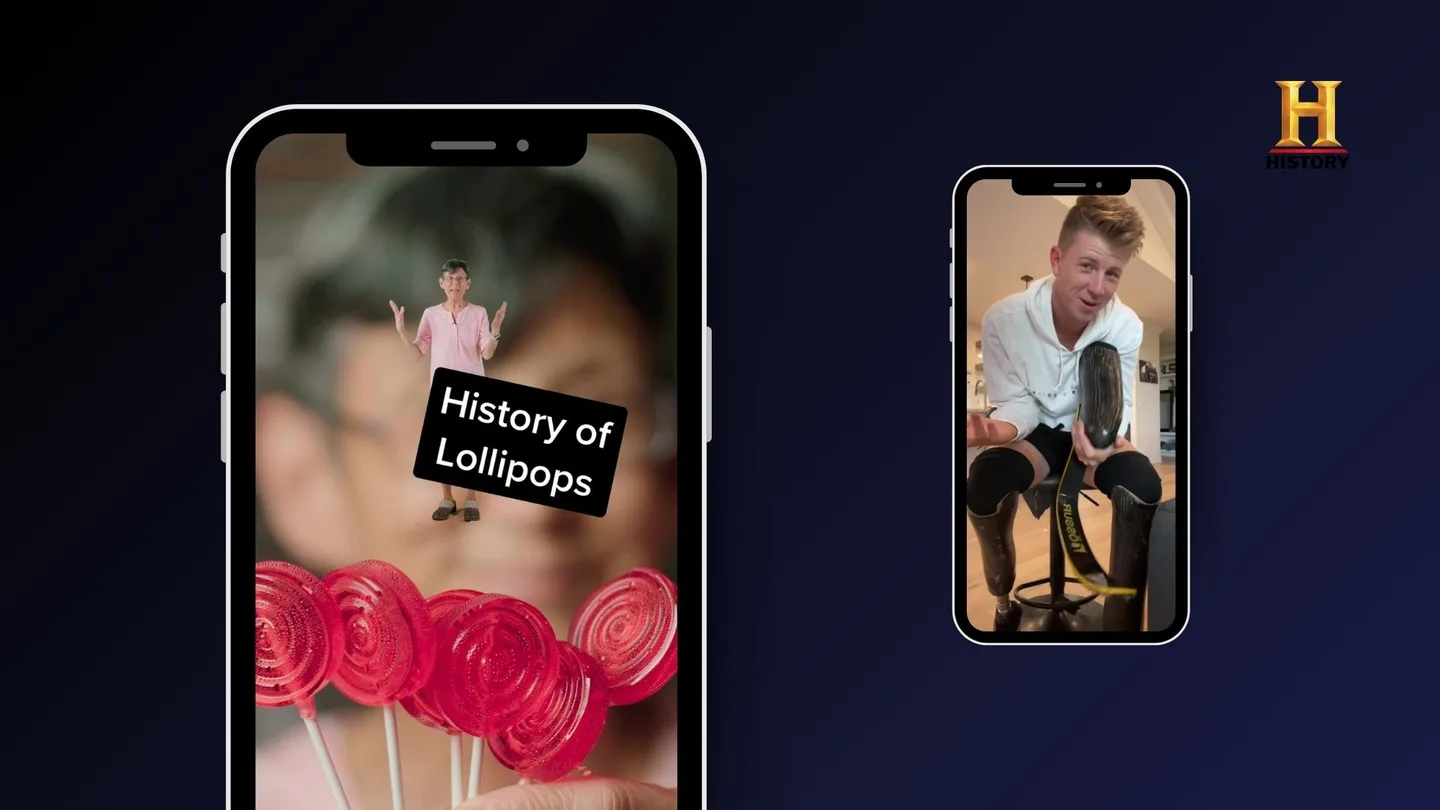
TikTok moves too quickly for rigid brand guidelines, and creators understand the hooks, pacing, language, and edit styles currently performing better than any brand team can specify in advance. We provide the product narrative, the legally approved claims, the offer, and the desired outcome, then give creators control of the creative execution. Audiences respond to unfiltered, native content over polished production — so the brief defines guardrails and objectives rather than dictating the script.
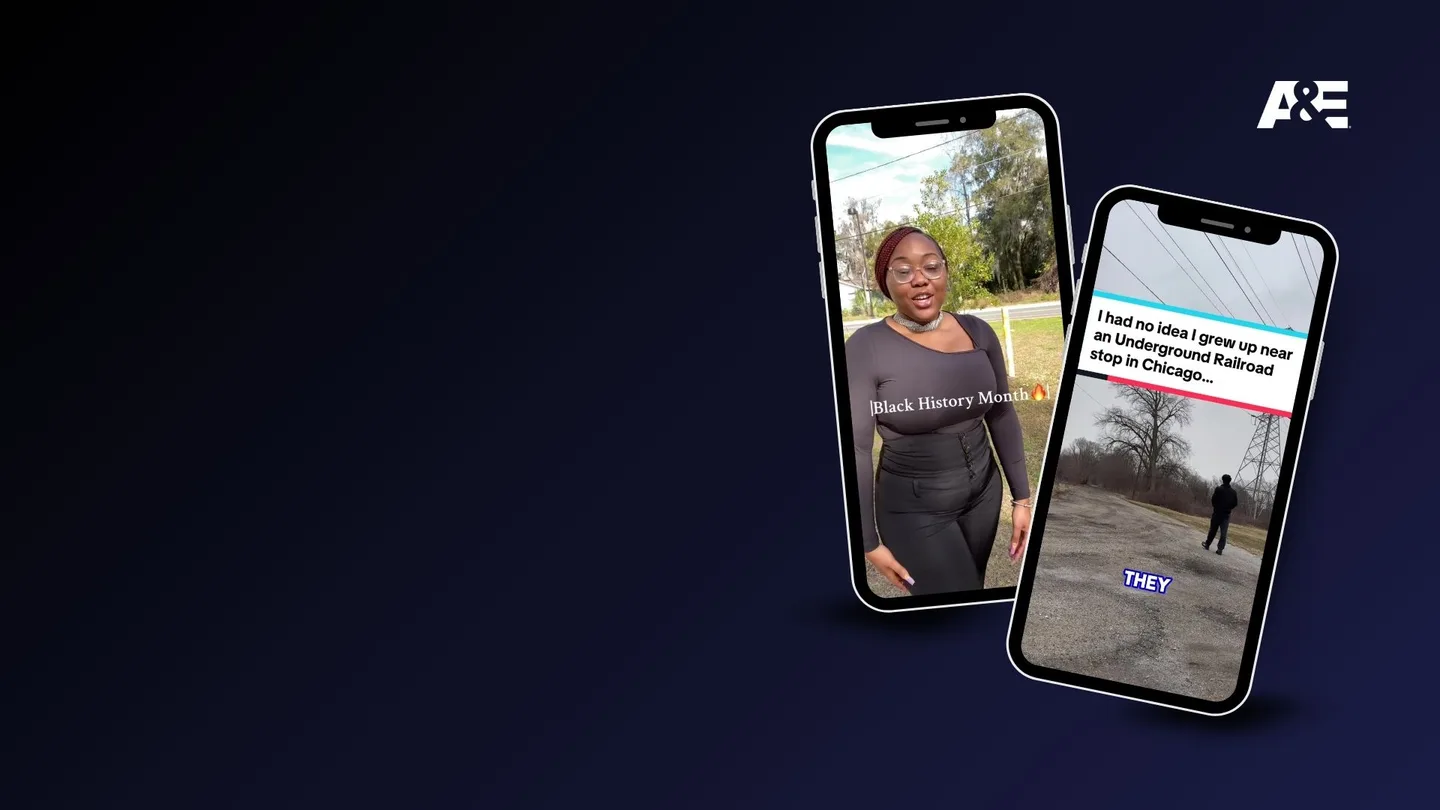
Because TikTok performance is variable, a single high-profile placement is a poor model. We run a larger cohort of creator videos, let organic performance reveal which hooks and formats are working, and concentrate investment behind the proven content rather than predicting winners in advance. This shifts TikTok from a speculative bet on virality to a structured, repeatable process — and generates the creative variation the platform requires to sustain performance over time.
Spark Ads are the central performance lever on TikTok because they amplify genuine creator posts while keeping the content attached to the creator's handle and credibility. We seed product to multiple creators, let them post natively, track hook strength, watch time, comments, saves, clicks, and conversion, secure Spark Ads authorisation for the top performers, and scale those winners through paid media with continual creative refresh. This is what converts TikTok from an unpredictable organic channel into a measurable acquisition system.
For consumer products that can be demonstrated visually, TikTok collapses the funnel: a creator can show the product, build desire, address objections in comments or live, and drive checkout without the viewer leaving the platform. Where relevant, we structure programs around creator demonstration, product tagging, affiliate incentives, live selling, and Spark Ads amplification, supported by retargeting and repeat-purchase mechanics. The priority throughout is products with a fast visual payoff — TikTok penalises anything that takes too long to explain.
Follower totals are a weak predictor of TikTok performance. We evaluate creators on average views per post, three-second hold rate, completion and rewatch rate, comment quality, share rate, prior Spark Ads performance, and demonstrated commercial ability through shop or affiliate sales. A creator with a modest following and strong conversion will routinely outperform a far larger account with passive viewership — and selection criteria are weighted accordingly.
We measure across the entire funnel rather than reporting views in isolation: attention via hold rate, watch time, completion, and rewatch rate; engagement via comments, shares, and saves; commercial performance via TikTok Shop and affiliate sales, landing-page traffic, and code usage; and paid efficiency via CPA, ROAS, and click-through once content is amplified. Every partnership runs FTC- and platform-compliant disclosure, combining the paid partnership label with clear caption and on-screen disclosure and proper affiliate or TikTok Shop disclosure.
An obsession with digital marketing technology combined with a deep appreciation for human experience enables and motivates us to transform the way brands interact with connected communities.


Bring the objective. NeoReach builds the creator roster, the platform mix, and the attribution that connects creator activity to pipeline, scoped by a senior strategist on the first call.
Ask anything else on the strategy call. A senior strategist runs the first 30 minutes.
Connect with usBecause reach is earned by native, creator-first content — not polished ads. Most users trust a brand more after seeing it from a creator, and the algorithm rewards authentic demonstration with reach no other channel matches.
Both. We cast trend-native creators for organic reach, then amplify the best-performing content as Spark Ads — keeping the creator handle and authenticity while buying incremental, optimized reach.
Every program runs on our real-time dashboard for views, engagement, CPM, CPE, and spend, with download-to-customer and sales attribution piped into your BI stack.
We match creators to your exact audience from a network of 250M+ creators, then screen every candidate for audience authenticity and bot ratio with our fraud models before contract.
Tell us about your goals and a senior strategist will scope the right mix of creators, channels, and measurement — usually within one business day.


A senior strategist will get back to you within one business day.
While you wait, get to know us: meet the team, about NeoReach, or browse our industry reports.
We use cookies and collect usage data to improve the site and to follow up on inquiries you send us. By using this site you agree. Privacy Policy.
